
Lire un Bilan : Dettes, Cash et Solvabilité
قراءة الميزانية: مرسى المغرب مفككة (الديون، النقد، حقوق الملكية)
Reading a balance sheet: Marsa Maroc decoded (debt, cash, equity)
Traduction en cours — contenu affiché en français.
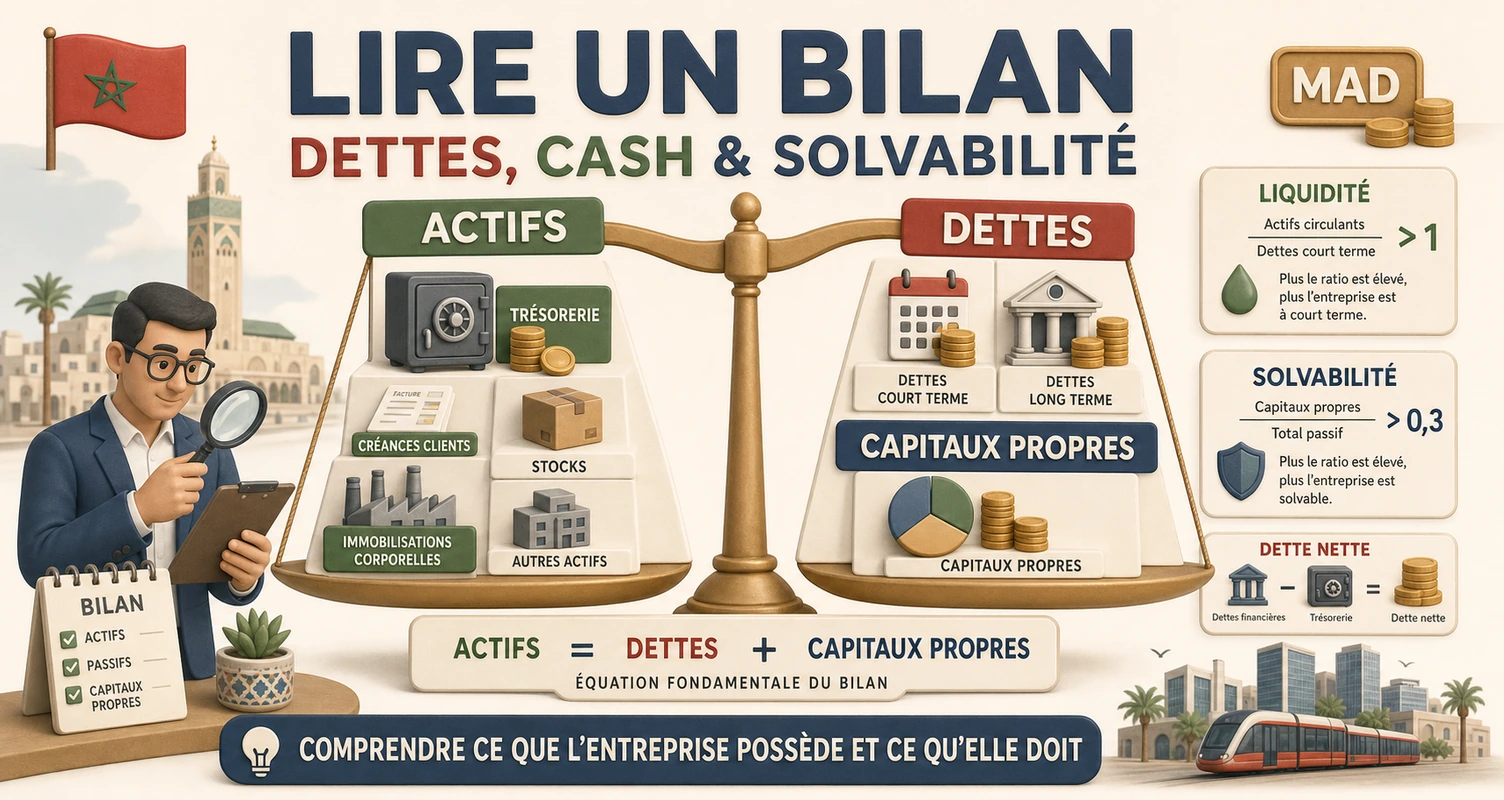
Cas pratique BVC – pourquoi commencer par Marsa Maroc ?
Cas pratique BVC : le bilan d’une societe cotee resume ce qu’elle possede (actif) et comment c’est finance (passif). Sur Casabourse, ouvrez la fiche Marsa Maroc puis le comparateur pour croiser dette nette, capitalisation (~59,8 Mds MAD) et EBITDA. Marsa est un cas pedagogique ideal : bilan sain, croissance du trafic, et dette nette negative – elle detient plus de cash que de dette financiere.
Les trois blocs a retenir
1. Actif : ce que la societe possede ou fait produire (immobilisations portuaires, terrains, equipements, stocks, creances clients, tresorerie).
2. Passif : comment c’est finance – fonds propres (capital + reserves + resultats non distribues) et dettes (emprunts bancaires, obligations, fournisseurs, provisions).
3. Equilibre fondamental : Actif = Passif. Si les fonds propres sont solides et la dette maitrisee, la societe absorbe mieux un choc (baisse de trafic, investissement capex).
Tableau bilan decode – Marsa Maroc 2024 (RFA)
| Concept bilan | Marsa Maroc 2024 | Marsa Maroc 2023 | Ce que ca signifie |
|---|---|---|---|
| Chiffre d’affaires | 5,01 Mds MAD | 4,32 Mds MAD | +15,9 % – croissance du trafic portuaire |
| EBITDA | 2,72 Mds MAD | 2,15 Mds MAD | Rentabilite operationnelle en hausse |
| Resultat net | 1,27 Mds MAD | 852 M MAD | Profit qui renforce les fonds propres |
| Dette brute (emprunts) | 1,60 Mds MAD | n/d publie | Endettement bancaire reel – pas zero |
| Dette nette | −792 M MAD | −24 M MAD | Negative = tresorerie nette (cash > dette) |
| Tresorerie nette (ordre de grandeur) | ~792 M MAD | ~24 M MAD | Marge de manoeuvre pour capex et dividende |
| EPS 2024 | 17,26 MAD | 11,61 MAD | Base du PER (~47x au cours ~815 MAD) |
| Dividende 2024 (DPS) | 9,50 MAD | 8,50 MAD | Payout ~55 % – dividende soutenable |
| Capitalisation boursiere | ~59,8 Mds MAD | – | Marche valorise la franchise portuaire |
Sources : RFA 2024 Marsa Maroc, fiche Casabourse. Dette nette negative : la ligne ” debt ” Casabourse est negative quand le cash depasse la dette financiere.
Dette nette negative : ce n’est pas ” zero dette “
Une erreur frequente : croire que Marsa ” n’a pas de dette “. En realite, elle affiche 1,60 Md de dette brute en 2024 – des emprunts pour financer des extensions portuaires (Nador West Med, modernisation des terminaux). Mais elle detient encore plus de tresorerie et equivalents (~2,4 Mds en ordre de grandeur si l’on additionne cash et placements court terme du bilan).
Dette nette = dette financiere − tresorerie et equivalents. Quand le resultat est negatif, on parle de tresorerie nette ou de dette nette negative. Pour un repreneur, la valeur d’entreprise (EV) devient : capitalisation moins le cash net – l’acheteur reprend du cash en plus des actifs operationnels.
Fonds propres : le ” matelas ” de securite
Les fonds propres representent la part du bilan financee par les actionnaires (capital social + primes + reserves + resultats accumules). Chaque annee, le resultat net de Marsa (1,27 Md en 2024) vient grossir ce matelas – sauf la part distribuee en dividende (9,50 MAD/action, payout ~55 %).
Un bilan solide se lit ainsi : fonds propres en croissance + dette nette faible ou negative + actifs productifs (quais, grues, concessions) qui generent un EBITDA recurrent. Marsa coche ces cases en 2024 : CA +16 %, RN +49 %, tresorerie nette en hausse.
Cash : pas du ” benefice en plus “
La tresorerie n’est pas un benefice disponible pour distribution immediate : une partie est reservee aux investissements (capex portuaire), une autre au fonds de roulement (delais clients, stocks). Marsa investit pour accompagner la croissance du trafic conteneurs et vrac. Le cash net conforte la solidite ; il ne garantit pas a lui seul que le cours est bon marche – le PER ~47x reflete une valorisation elevee pour une croissance et une qualite de bilan superieures.
Comparer Marsa a un pair endette – lecture comparateur
Dans le comparateur, confrontez Marsa a Maroc Telecom : IAM affiche une dette nette positive (~22,4 Mds en 2024) pour un EBITDA ~19,2 Mds – ratio ~1,17x, maitrise mais structurel. Marsa, plus petite en capitalisation (~60 Mds vs ~80 Mds), combine croissance et bilan plus leger. Les deux sont des valeurs de qualite ; le bilan explique une partie de la prime de valorisation de Marsa.
Choisissez la bonne réponse pour chaque question et consultez votre résultat à la fin.
La réponse attendue privilégie une décision structurée : faits, méthode, risque et cohérence avec le portefeuille.
La réponse attendue privilégie une décision structurée : faits, méthode, risque et cohérence avec le portefeuille.
La réponse attendue privilégie une décision structurée : faits, méthode, risque et cohérence avec le portefeuille.
La réponse attendue privilégie une décision structurée : faits, méthode, risque et cohérence avec le portefeuille.
La réponse attendue privilégie une décision structurée : faits, méthode, risque et cohérence avec le portefeuille.
حالة عملية BVC — لماذا نبدأ بمرسى المغرب؟
حالة عملية BVC: ميزانية شركة مدرجة تلخص ما تملكه (الأصول) وكيف يُموَّل (الخصوم). على Casabourse، افتح بطاقة مرسى المغرب ثم المُقارِن لاقاطع الدين الصافي والقيمة السوقية (~59,8 مليار درهم) وEBITDA. مرسى حالة تعليمية مثالية: ميزانية سليمة، نمو حركة، ودين صافي سالب — تمتلك نقداً أكثر من دينها المالي.
الكتل الثلاث للاحتفاظ
1. الأصول: ما تملكه الشركة أو تجعله ينتج (أصول موانئ، أراضٍ، معدات، مخزون، ذمم عملاء، خزينة).
2. الخصوم: كيف يُموَّل — حقوق الملكية (رأس المال + احتياطيات + أرباح غير موزعة) والديون (قروض بنكية، سندات، موردون، مخصصات).
3. التوازن الأساسي: الأصول = الخصوم. إذا حقوق الملكية قوية والدين مضبوط، الشركة تمتص الصدمة أفضل (تراجع حركة، استثمار capex).
جدول الميزانية مفكك — مرسى المغرب 2024 (RFA)
| مفهوم الميزانية | مرسى المغرب 2024 | مرسى المغرب 2023 | ماذا يعني |
|---|---|---|---|
| رقم الأعمال | 5,01 مليار درهم | 4,32 مليار درهم | +15,9% — نمو حركة الموانئ |
| EBITDA | 2,72 مليار درهم | 2,15 مليار درهم | ربحية تشغيلية في ارتفاع |
| النتيجة الصافية | 1,27 مليار درهم | 852 مليون درهم | ربح يعزز حقوق الملكية |
| الدين الإجمالي (قروض) | 1,60 مليار درهم | غ/م منشور | مديونية بنكية حقيقية — ليست صفراً |
| الدين الصافي | −792 مليون درهم | −24 مليون درهم | سالب = خزينة صافية (نقد > دين) |
| الخزينة الصافية (ترتيب الحجم) | ~792 مليون درهم | ~24 مليون درهم | هامش مناورة لـ capex والتوزيع |
| EPS 2024 | 17,26 درهم | 11,61 درهم | أساس PER (~47× بسعر ~815 درهم) |
| توزيع الأرباح 2024 (DPS) | 9,50 درهم | 8,50 درهم | Payout ~55% — توزيع مستدام |
| القيمة السوقية | ~59,8 مليار درهم | – | السوق يُقيّم امتياز الموانئ |
المصادر: RFA 2024 مرسى المغرب، بطاقة Casabourse. الدين الصافي السالب: سطر «debt» في Casabourse سالب عندما يتجاوز النقد الدين المالي.
الدين الصافي السالب: ليس «صفر دين»
خطأ شائع: الاعتقاد أن مرسى «بلا دين». في الواقع، تعرض 1,60 مليار دين إجمالي في 2024 — قروض لتمويل توسعات موانئ (الناظور غرب المتوسط، تحديث المحطات). لكنها تمتلك أكثر من خزينة ومعادلات (~2,4 مليار تقريباً بجمع النقد والاستثمارات قصيرة الأجل من الميزانية).
الدين الصافي = الدين المالي − الخزينة ومعادلاتها. عندما النتيجة سالبة، نتحدث عن خزينة صافية أو دين صافي سالب. للمشتري، قيمة المؤسسة (EV) تصبح: القيمة السوقية ناقص النقد الصافي — المشتري يأخذ نقداً إضافياً مع الأصول التشغيلية.
حقوق الملكية: «الوسادة» الأمنية
حقوق الملكية تمثل الجزء المموَّل من المساهمين (رأس المال + علاوات + احتياطيات + أرباح متراكمة). كل سنة، النتيجة الصافية لمرسى (1,27 مليار في 2024) تكبر هذه الوسادة — ما عدا الجزء الموزّع (9,50 درهم/سهم، payout ~55%).
ميزانية سليمة تُقرأ هكذا: حقوق ملكية في نمو + دين صافي منخفض أو سالب + أصول منتجة (أرصفة، رافعات، امتيازات) تولّد EBITDA متكرراً. مرسى تحقق ذلك في 2024: رقم أعمال +16%، RN +49%، خزينة صافية في ارتفاع.
النقد: ليس «ربحاً إضافياً»
الخزينة ليست ربحاً متاحاً للتوزيع الفوري: جزء محجوز للاستثمارات (capex موانئ)، جزء لرأس المال العامل (آجال عملاء، مخزون). مرسى تستثمر لمواكبة نمو حركة الحاويات والسائب. النقد الصافي يطمئن على المتانة؛ لا يضمن وحده أن السعر رخيص — PER ~47× يعكس تقييماً مرتفعاً لنمو وجودة ميزانية فائقة.
مقارنة مرسى بنظير مديون — قراءة المُقارِن
في المُقارِن، واجه مرسى اتصالات المغرب: IAM تعرض ديناً صافياً موجباً (~22,4 مليار في 2024) لـ EBITDA ~19,2 مليار — نسبة ~1,17×، مضبوطة لكن هيكلية. مرسى، أصغر في القيمة السوقية (~60 مليار مقابل ~80 مليار)، تجمع نمواً وميزانية أخف. كلاهما قيم جودة؛ الميزانية تشرح جزءاً من علاوة تقييم مرسى.
اختر الإجابة الصحيحة لكل سؤال واطلع على نتيجتك في النهاية.
الدين الصافي = الدين − النقد؛ نتيجة سالبة تعني خزينة صافية (~792 مليون درهم).
مرسى تحمل ~1,60 مليار قروض؛ النقد يتجاوز هذا الدين، إذن الدين الصافي سالب.
RN (1,27 مليار في 2024) يُضاف للاحتياطيات؛ التوزيع يأخذ جزءاً.
DPS 9,50 درهم لـ EPS ~17,26 درهم؛ payout منشور ~55%.
المُقارِن يوازن الدين الصافي وEBITDA وPER والعائد على قاعدة موحدة.
BVC practical case — why start with Marsa Maroc?
BVC practical case: a listed company’s balance sheet summarises what it owns (assets) and how it is financed (liabilities). On Casabourse, open the Marsa Maroc page then the comparator to cross net debt, market cap (~59.8 bn MAD) and EBITDA. Marsa is an ideal teaching case: healthy balance sheet, traffic growth, and negative net debt — it holds more cash than financial debt.
The three blocks to remember
1. Assets: what the company owns or generates (port fixed assets, land, equipment, inventory, receivables, cash).
2. Liabilities: how it is financed — equity (capital + reserves + retained earnings) and debt (bank loans, bonds, payables, provisions).
3. Fundamental balance: Assets = Liabilities. If equity is solid and debt controlled, the company absorbs shocks better (traffic drop, capex investment).
Decoded balance sheet table — Marsa Maroc 2024 (RFA)
| Balance sheet concept | Marsa Maroc 2024 | Marsa Maroc 2023 | What it means |
|---|---|---|---|
| Revenue | 5.01 bn MAD | 4.32 bn MAD | +15.9 % — port traffic growth |
| EBITDA | 2.72 bn MAD | 2.15 bn MAD | Operating profitability rising |
| Net income | 1.27 bn MAD | 852 M MAD | Profit that strengthens equity |
| Gross debt (borrowings) | 1.60 bn MAD | n/d published | Real bank debt — not zero |
| Net debt | −792 M MAD | −24 M MAD | Negative = net cash (cash > debt) |
| Net cash (order of magnitude) | ~792 M MAD | ~24 M MAD | Room for capex and dividends |
| 2024 EPS | 17.26 MAD | 11.61 MAD | Basis for P/E (~47x at price ~815 MAD) |
| 2024 dividend (DPS) | 9.50 MAD | 8.50 MAD | Payout ~55 % — sustainable dividend |
| Market cap | ~59.8 bn MAD | – | Market values the port franchise |
Sources: Marsa Maroc 2024 RFA, Casabourse page. Negative net debt: the Casabourse “debt” line is negative when cash exceeds financial debt.
Negative net debt: it is not “zero debt”
A common mistake: believing Marsa “has no debt”. In reality it shows 1.60 bn of gross debt in 2024 — borrowings to finance port extensions (Nador West Med, terminal modernisation). But it holds even more cash and equivalents (~2.4 bn in order of magnitude if you add cash and short-term investments from the balance sheet).
Net debt = financial debt − cash and equivalents. When the result is negative, we speak of net cash or negative net debt. For an acquirer, enterprise value (EV) becomes: market cap minus net cash — the buyer takes on cash in addition to operating assets.
Equity: the safety cushion
Equity is the share of the balance sheet financed by shareholders (share capital + premiums + reserves + accumulated earnings). Each year, Marsa’s net income (1.27 bn in 2024) grows this cushion — except the portion paid as dividend (9.50 MAD/share, payout ~55 %).
A solid balance sheet reads like this: growing equity + low or negative net debt + productive assets (quays, cranes, concessions) generating recurring EBITDA. Marsa ticks these boxes in 2024: revenue +16 %, net income +49 %, net cash rising.
Cash: not “extra profit”
Cash is not profit available for immediate distribution: part is reserved for investment (port capex), part for working capital (customer terms, inventory). Marsa invests to support container and bulk traffic growth. Net cash reinforces solidity; it alone does not guarantee the stock is cheap — P/E ~47x reflects a high valuation for superior growth and balance sheet quality.
Compare Marsa to a leveraged peer — comparator read
In the comparator, compare Marsa with Maroc Telecom: IAM shows positive net debt (~22.4 bn in 2024) for EBITDA ~19.2 bn — ratio ~1.17x, controlled but structural. Marsa, smaller in market cap (~60 bn vs ~80 bn), combines growth with a lighter balance sheet. Both are quality stocks; the balance sheet explains part of Marsa’s valuation premium.
Key takeaways — 4 lines to note on any page
- Net debt (positive or negative?)
- Equity (3-year trend)
- Net debt / EBITDA (if EBITDA published)
- Payout (is the dividend funded by the balance sheet or earnings?)
Key takeaways
- Assets = Liabilities; equity = shareholders’ share.
- Marsa 2024: net debt −792 M MAD (net cash).
- Gross debt ~1.60 bn exists — not a company without borrowings.
- Net income 1.27 bn strengthens equity; DPS 9.50 MAD, payout ~55 %.
- Check the comparator and RFA before any decision.
Self-check
- What does negative net debt mean for Marsa Maroc in 2024?
- What is the order of magnitude of Marsa’s gross debt in 2024?
- How does net income affect equity?
- What is Marsa’s approximate payout on the 2024 dividend?
- Which Casabourse tool compares Marsa with Maroc Telecom?