
Banques & Assurances : Pourquoi le CA n’existe pas ?
ATW مقابل وفا للتأمين: لماذا لا ينطبق رقم الأعمال
ATW vs Wafa Assurance: why revenue does not apply
Traduction en cours — contenu affiché en français.
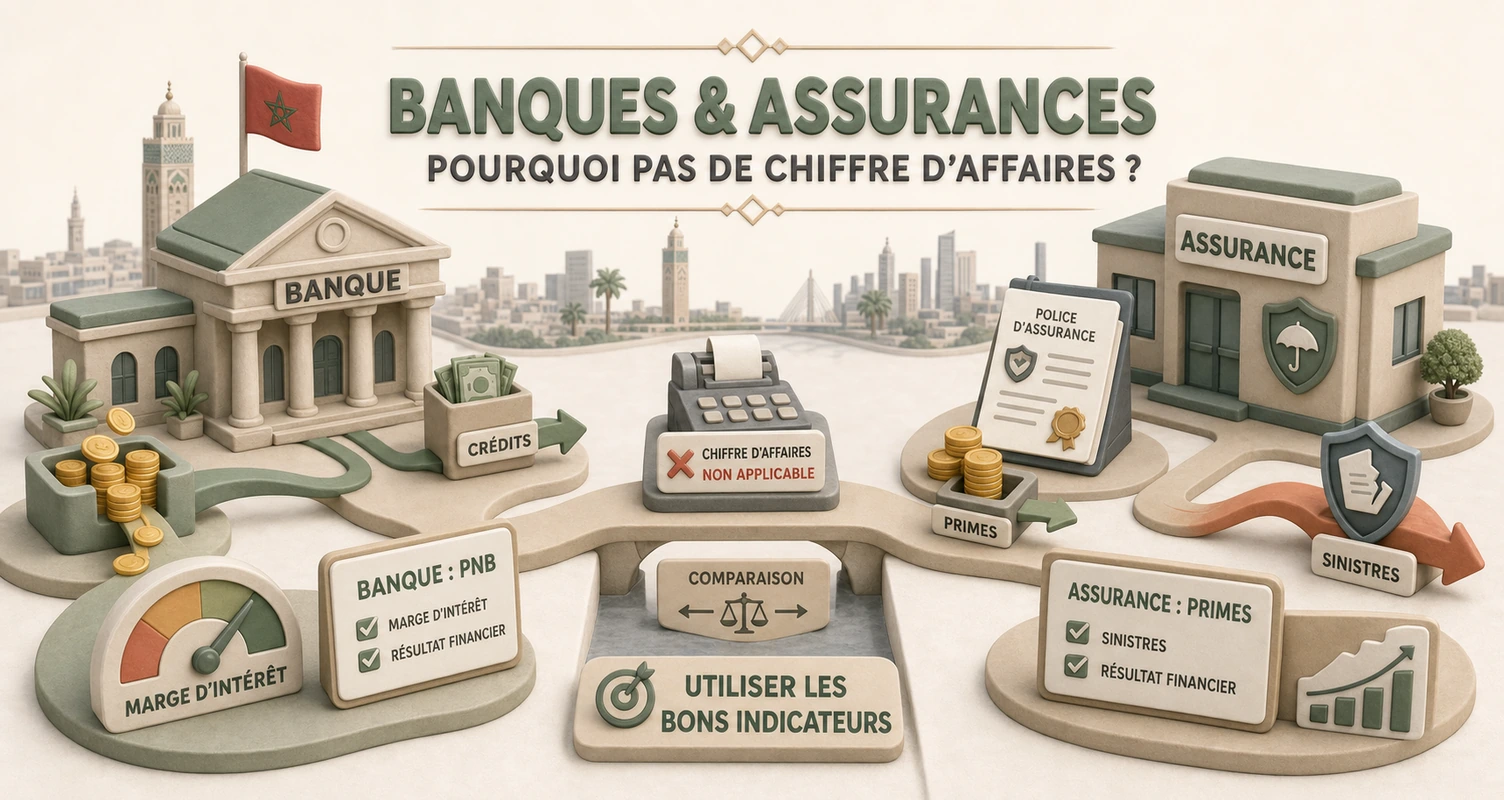
L’erreur du debutant : comparer ATW et Wafa au CA
Un investisseur ouvre le compte de resultat d’ATW et de Wafa et lit ” chiffre d’affaires ” ou ” produits “. Il conclut qu’ATW (~34,5 Mds MAD de PNB) est ” 2,6 fois plus grande ” que Wafa (~13 Mds de primes). C’est directionnellement vrai mais methodologiquement faux pour comparer la performance :
- Le PNB bancaire melange marge d’interet, commissions et marche – ce n’est pas un CA de vente de biens.
- Les primes d’assurance sont un encaissement aujourd’hui pour des sinistres demain – le CA assureur inclut des provisions techniques.
- Comparer PER ou marge nette / CA entre les deux sans retraitement mene a des conclusions absurdes.
PNB vs primes – definitions
Produit net bancaire (PNB) : revenus d’interets nets + commissions + resultat de marche − charges liees. C’est le ” top line ” d’ATW. En 2024, le PNB consolide d’Attijariwafa est d’environ 34,5 Mds MAD (+15 %).
Primes emises / CA assurance : montant facture aux assures. Pour Wafa Assurance, le CA/primes consolides 2024 sont d’environ 13,07 Mds MAD. Une partie sera payee en sinistres plus tard ; une autre finance les placements.
Pourquoi ” CA ” ne s’applique pas : ni le PNB ni les primes ne mesurent une marge commerciale simple. La banque transforme des encours ; l’assureur transforme des risques et des placements.
Fiche ATW vs Wafa – indicateurs propres (2024)
| Indicateur | Attijariwafa Bank (ATW) | Wafa Assurance (WAA) | Comparable ? |
|---|---|---|---|
| ” Top line ” sectoriel | PNB ~34,5 Mds MAD | Primes ~13,07 Mds MAD | Non – definitions differentes |
| Resultat net 2024 | 9,50 Mds MAD | 854 M MAD | Oui – mais PER differents |
| Indicateur cle #1 | ROE ~15 % · P/B ~1,5x | Ratio combine ~96,8 % · P/B ~1,35x | Grilles sectorielles separees |
| Indicateur cle #2 | Coef. exploitation ~38,5 % | Sinistralite non-vie ~64,2 % | Non comparables entre eux |
| Indicateur cle #3 | Cout du risque ~55 pb | Resultat financier ~+412 M MAD | Moteurs differents |
| Dividende / rendement | 19 MAD (~3,2 %) | 140 MAD (~2,6 %) | Oui – avec liquidite WAA faible |
| Cours / capi | ~680 MAD / ~146 Mds | ~5 700 MAD / ~20 Mds | Liquidite ATW >> WAA |
| Lien groupe | Holdco Attijari | Filiale Attijariwafa – synergies bancassurance | Correles mais pas identiques |
Sources : RFA 2024 ATW et Wafa Assurance, fiches Casabourse. Wafa est liee au groupe ATW – ne pas double-compter le risque groupe.
Comment lire ATW – rappel PNB
Pour Attijariwafa Bank, oubliez le CA industriel. La grille :
- PNB et sa croissance (volume credits + marge).
- Coefficient d’exploitation (charges / PNB) – ATW ~38,5 %.
- Cout du risque et NPL – thermometre du cycle credit.
- ROE vs P/B – valorisation au fonds propres.
Le PER (~13,9x) est secondaire. Une marge nette / PNB elevee ne signifie pas la meme chose qu’une marge nette / CA chez un industriel.
Comment lire Wafa – rappel primes
Pour Wafa Assurance, la grille assurance :
- Primes et croissance (parts de marche IARD, vie).
- Ratio combine non-vie (~96,8 %) – sinistres + frais / primes ; sous 100 % = technique rentable.
- Resultat financier (~412 M MAD) – rendement des placements ; sensible au MASI et aux taux BAM (2,25 %).
- ROE vs P/B – comme ATW, le bilan est central.
Comparer la ” marge nette / primes ” de Wafa au ” RN / PNB ” d’ATW n’a pas de sens economique : les provisions techniques absorbent une part du flux assureur.
Pourquoi le CA ne s’applique pas – synthese
| Question | Reponse |
|---|---|
| Peut-on comparer PNB et primes directement ? | Non – ce sont des flux heterogenes (intermediation vs transfert de risque) |
| Quel ratio ” marge ” utiliser pour ATW ? | RN / PNB ou surtout ROE ; coef. exploitation pour l’efficacite |
| Quel ratio ” marge ” pour Wafa ? | Ratio combine (technique) + contribution resultat financier |
| Meme PER = meme bonne affaire ? | Non – PER 14x banque = PER 14x assurance (cyclicalite placements) |
Lien bancassurance – correlations a surveiller
Wafa appartient a l’ecosysteme Attijariwafa. Une deterioration du cout du risque chez ATW peut signaler des stress sur le portefeuille credit des clients assures Wafa – et inversement, un ratio combine qui se degrade chez Wafa peut peser sur la valeur de marque du groupe. Pour un portefeuille, detenir ATW + WAA concentre le risque Attijari : comparez plutot Wafa a Sanlam Maroc dans le comparateur pour l’assurance pure, et ATW a BCP pour la banque pure.
Cas pratique BVC
Ouvrez les RFA 2024 d’ATW et Wafa sur Casabourse. Relevez PNB (ligne ” produits nets bancaires “) et primes/CA assurance. Calculez RN/PNB pour ATW et RN/primes pour Wafa – puis expliquez en une phrase pourquoi ces deux ratios ne sont pas comparables entre eux. Dans le comparateur, ajoutez BCP et Sanlam : comparez ROE et P/B au sein de chaque secteur, jamais PNB vs primes.
Choisissez la bonne réponse pour chaque question et consultez votre résultat à la fin.
La réponse attendue privilégie une décision structurée : faits, méthode, risque et cohérence avec le portefeuille.
La réponse attendue privilégie une décision structurée : faits, méthode, risque et cohérence avec le portefeuille.
La réponse attendue privilégie une décision structurée : faits, méthode, risque et cohérence avec le portefeuille.
La réponse attendue privilégie une décision structurée : faits, méthode, risque et cohérence avec le portefeuille.
La réponse attendue privilégie une décision structurée : faits, méthode, risque et cohérence avec le portefeuille.
خطأ المبتدئ: مقارنة ATW ووفا برقم الأعمال
مستثمر يفتح حساب النتائج لـ ATW ووفا ويقرأ «رقم الأعمال» أو «المنتجات». يستنتج أن ATW (~34,5 مليار درهم PNB) «أكبر 2,6 مرة» من وفا (~13 مليار أقساط). هذا صحيح اتجاهياً لكن خاطئ منهجياً لمقارنة الأداء:
- PNB البنكي يخلط هامش الفائدة والعمولات والسوق — ليس رقم أعمال بيع سلع.
- أقساط التأمين تحصيل اليوم لحوادث الغد — رقم أعمال المؤمّن يتضمن مخصصات تقنية.
- مقارنة PER أو هامش صافي / رقم الأعمال بينهما دون إعادة معالجة تؤدي لاستنتاجات سخيفة.
PNB مقابل الأقساط — التعريفات
المنتج الصافي البنكي (PNB): إيرادات الفوائد الصافية + العمولات + نتيجة السوق − الرسوم المرتبطة. هذا «السطر العلوي» لـ ATW. في 2024، PNB التجاري وفا الموحّد نحو 34,5 مليار درهم (+15%).
الأقساط المكتتبة / رقم أعمال التأمين: المبلغ المفوتر للمؤمَّن عليهم. لوفا للتأمين، رقم الأعمال/الأقساط الموحّدة 2024 نحو 13,07 مليار درهم. جزء يُدفع حوادث لاحقاً؛ جزء يموّل الاستثمارات.
لماذا لا ينطبق «رقم الأعمال»: لا PNB ولا الأقساط يقيسان هامشاً تجارياً بسيطاً. البنك يحوّل المبالغ المستحقة؛ المؤمّن يحوّل المخاطر والاستثمارات.
بطاقة ATW مقابل وفا — مؤشرات خاصة بالقطاع (2024)
| المؤشر | التجاري وفا بنك (ATW) | وفا للتأمين (WAA) | قابل للمقارنة؟ |
|---|---|---|---|
| «السطر العلوي» القطاعي | PNB ~34,5 مليار درهم | أقساط ~13,07 مليار درهم | لا — تعريفات مختلفة |
| النتيجة الصافية 2024 | 9,50 مليار درهم | 854 مليون درهم | نعم — لكن PER مختلف |
| المؤشر الرئيسي #1 | ROE ~15% · P/B ~1,5× | نسبة مجمّعة ~96,8% · P/B ~1,35× | شبكات قطاعية منفصلة |
| المؤشر الرئيسي #2 | معامل الاستغلال ~38,5% | نسبة الحوادث غير الحياة ~64,2% | غير قابل للمقارنة بينهما |
| المؤشر الرئيسي #3 | تكلفة المخاطر ~55 نقطة أساس | النتيجة المالية ~+412 مليون درهم | محركات مختلفة |
| توزيع الأرباح / العائد | 19 درهم (~3,2%) | 140 درهم (~2,6%) | نعم — مع سيولة WAA ضعيفة |
| السعر / القيمة السوقية | ~680 درهم / ~146 مليار | ~5,700 درهم / ~20 مليار | سيولة ATW >> WAA |
| الرابط الجماعي | Holdco Attijari | شركة تابعة Attijariwafa — تآزر bancassurance | مرتبطان لكن غير متطابقين |
المصادر: RFA 2024 ATW ووفا للتأمين، بطاقات Casabourse. وفا مرتبطة بمجموعة ATW — لا تحسب مخاطر المجموعة مرتين.
كيف تقرأ ATW — تذكير PNB
لـ التجاري وفا بنك، انسَ رقم الأعمال الصناعي. الشبكة:
- PNB ونموه (حجم القروض + الهامش).
- معامل الاستغلال (الرسوم / PNB) — ATW ~38,5%.
- تكلفة المخاطر وNPL — مقياس دورة الائتمان.
- ROE مقابل P/B — تقييم على حقوق الملكية.
PER (~13,9×) ثانوي. هامش صافي / PNB مرتفع لا يعني نفس شيء هامش صافي / رقم أعمال عند صناعي.
كيف تقرأ وفا — تذكير الأقساط
لـ وفا للتأمين، شبكة التأمين:
- الأقساط ونموها (حصص السوق IARD، الحياة).
- النسبة المجمّعة غير الحياة (~96,8%) — الحوادث + المصاريف / الأقساط؛ ودون 100% = تقنياً مربح.
- النتيجة المالية (~412 مليون درهم) — عائد الاستثمارات؛ حساس لـ MASI وأسعار بنك المغرب (2,25%).
- ROE مقابل P/B — كـ ATW، الميزانية محورية.
مقارنة «هامش صافي / أقساط» وفا بـ «RN / PNB» ATW بلا معنى اقتصادي: المخصصات التقنية تمتص جزءاً من تدفق المؤمّن.
لماذا لا ينطبق رقم الأعمال — خلاصة
| السؤال | الجواب |
|---|---|
| هل يمكن مقارنة PNB والأقساط مباشرة؟ | لا — تدفقات متباينة (وساطة مقابل نقل مخاطر) |
| أي نسبة «هامش» لـ ATW؟ | RN / PNB أو ROE؛ معامل الاستغلال للكفاءة |
| أي نسبة «هامش» لوفا؟ | النسبة المجمّعة (تقني) + مساهمة النتيجة المالية |
| نفس PER = نفس الصفقة الجيدة؟ | لا — PER 14× بنك ≠ PER 14× تأمين (دورية الاستثمارات) |
رابط bancassurance — ارتباطات للمراقبة
وفا تنتمي لمنظومة Attijariwafa. تدهور تكلفة المخاطر عند ATW قد يشير لضغوط على محفظة ائتمان عملاء وفا — والعكس، تدهور النسبة المجمّعة عند وفا قد يثقل قيمة العلامة الجماعية. لمحفظة، امتلاك ATW + WAA يُركّز مخاطر Attijari: قارن وفا بـ Sanlam Maroc في المُقارِن للتأمين الصرف، وATW بـ BCP للبنك الصرف.
حالة عملية BVC
افتح RFA 2024 لـ ATW ووفا على Casabourse. استخرج PNB (سطر «المنتجات الصافية البنكية») وأقساط/رقم أعمال التأمين. احسب RN/PNB لـ ATW وRN/أقساط لوفا — ثم اشرح في جملة لماذا هاتان النسبتان غير قابلتين للمقارنة. في المُقارِن، أضف BCP وSanlam: قارن ROE وP/B داخل كل قطاع، لا PNB مقابل أقساط أبداً.
اختر الإجابة الصحيحة لكل سؤال واطلع على نتيجتك في النهاية.
البنك والمؤمّن لهما شبكات محاسبية واقتصادية مختلفة.
المنتج الصافي البنكي يحل محل رقم الأعمال للبنك.
النسبة المجمّعة تقيس الربحية التقنية لتأمين غير الحياة.
امتلاك ATW + WAA يُركّز مخاطر مجموعة Attijari.
المُقارِن يوازن نسباً متجانسة حسب القطاع.
The beginner mistake: comparing ATW and Wafa on revenue
An investor opens the income statement for ATW and Wafa and reads “revenue” or “income”. They conclude ATW (~34.5 bn MAD NBI) is “2.6 times larger” than Wafa (~13 bn premiums). That is directionally true but methodologically wrong for comparing performance:
- Bank NBI mixes net interest margin, fees and trading — it is not goods-sale revenue.
- Insurance premiums are cash collected today for claims tomorrow — insurer revenue includes technical provisions.
- Comparing P/E or net margin / revenue between the two without adjustment leads to absurd conclusions.
NBI vs premiums — definitions
Net banking income (NBI): net interest income + fees + trading result − related charges. That is ATW’s “top line”. In 2024, Attijariwafa consolidated NBI is about 34.5 bn MAD (+15 %).
Written premiums / insurance revenue: amount billed to policyholders. For Wafa Assurance, 2024 consolidated revenue/premiums are about 13.07 bn MAD. Part will be paid out in claims later; part funds investments.
Why “revenue” does not apply: neither NBI nor premiums measure a simple commercial margin. The bank transforms loan books; the insurer transforms risk and investments.
ATW vs Wafa sheet — sector-specific indicators (2024)
| Indicator | Attijariwafa Bank (ATW) | Wafa Assurance (WAA) | Comparable? |
|---|---|---|---|
| Sector “top line” | NBI ~34.5 bn MAD | Premiums ~13.07 bn MAD | No — different definitions |
| 2024 net income | 9.50 bn MAD | 854 M MAD | Yes — but different P/Es |
| Key indicator #1 | ROE ~15 % · P/B ~1.5x | Combined ratio ~96.8 % · P/B ~1.35x | Separate sector grids |
| Key indicator #2 | Cost-to-income ~38.5 % | Non-life loss ratio ~64.2 % | Not comparable with each other |
| Key indicator #3 | Cost of risk ~55 bp | Financial result ~+412 M MAD | Different drivers |
| Dividend / yield | 19 MAD (~3.2 %) | 140 MAD (~2.6 %) | Yes — with low WAA liquidity |
| Price / market cap | ~680 MAD / ~146 bn | ~5,700 MAD / ~20 bn | ATW liquidity >> WAA |
| Group link | Attijari holdco | Attijariwafa subsidiary — bancassurance synergies | Correlated but not identical |
Sources: 2024 RFAs ATW and Wafa Assurance, Casabourse pages. Wafa is linked to the ATW group — do not double-count group risk.
How to read ATW — NBI reminder
For Attijariwafa Bank, forget industrial revenue. The grid:
- NBI and its growth (loan volume + margin).
- Cost-to-income ratio (expenses / NBI) — ATW ~38.5 %.
- Cost of risk and NPL — credit cycle thermometer.
- ROE vs P/B — valuation on equity.
P/E (~13.9x) is secondary. A high net margin / NBI does not mean the same as net margin / revenue at an industrial company.
How to read Wafa — premiums reminder
For Wafa Assurance, the insurance grid:
- Premiums and growth (P&C market share, life).
- Non-life combined ratio (~96.8 %) — claims + expenses / premiums; below 100 % = technically profitable.
- Financial result (~412 M MAD) — investment returns; sensitive to MASI and BAM rates (2.25 %).
- ROE vs P/B — as with ATW, the balance sheet is central.
Comparing Wafa’s “net margin / premiums” with ATW’s “net income / NBI” makes no economic sense: technical provisions absorb part of the insurer’s flow.
Why revenue does not apply — summary
| Question | Answer |
|---|---|
| Can you compare NBI and premiums directly? | No — heterogeneous flows (intermediation vs risk transfer) |
| Which “margin” ratio for ATW? | Net income / NBI or especially ROE; cost-to-income for efficiency |
| Which “margin” ratio for Wafa? | Combined ratio (technical) + financial result contribution |
| Same P/E = same good deal? | No — P/E 14x bank ≠ P/E 14x insurance (investment cyclicality) |
Bancassurance link — correlations to watch
Wafa belongs to the Attijariwafa ecosystem. A deterioration in cost of risk at ATW can signal stress on the credit portfolio of Wafa’s insured clients — and conversely, a worsening combined ratio at Wafa can weigh on group brand value. For a portfolio, holding ATW + WAA concentrates Attijari risk: compare Wafa with Sanlam Maroc in the comparator for pure insurance, and ATW with BCP for pure banking.
Key takeaways
- ATW: NBI ~34.5 bn — not revenue; Wafa: premiums ~13 bn — not comparable to NBI.
- Separate grids: NBI/ROE/P/B for ATW; combined ratio/investments for Wafa.
- Classic revenue does not apply — a frequent cross-sector comparison mistake.
- Wafa = Attijari subsidiary — watch group concentration.
- Pages ATW and Wafa on Casabourse.
BVC practical case
Open the 2024 RFAs for ATW and Wafa on Casabourse. Note NBI (“net banking income” line) and insurance premiums/revenue. Calculate net income/NBI for ATW and net income/premiums for Wafa — then explain in one sentence why these two ratios are not comparable. In the comparator, add BCP and Sanlam: compare ROE and P/B within each sector, never NBI vs premiums.
Self-check
- Why is comparing ATW and Wafa on revenue a methodological error?
- What is the correct “top line” for ATW in 2024?
- What is the key technical indicator for Wafa Assurance?
- What is the link between ATW and Wafa at group level?
- How do you use the comparator without mixing NBI and premiums?