
Support et Résistance : Repérer les zones d’achat
خريطة المستويات — التجاري وفا بنك (ATW)
ATW level map
Traduction en cours — contenu affiché en français.
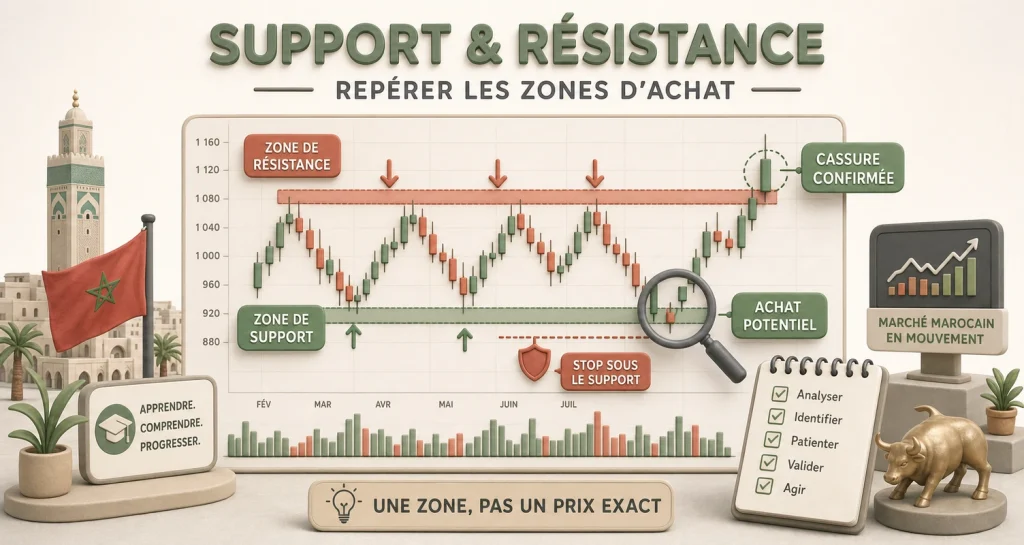
Support et resistance : la grammaire du prix
Un support est une zone ou les acheteurs sont historiquement intervenus : le cours rebondit. Une resistance est l’inverse : les vendeurs ont bloque la hausse. Sur Casabourse, ces niveaux ne sont pas des lignes magiques – ce sont des zones de probabilite construites a partir de rebonds passes, de volumes et de psychologie collective.
cas pratique BVC : ouvrez la fiche Attijariwafa Bank sur Casabourse. Zoomez sur les six derniers mois. Reperez au moins trois points ou le cours a rebondi vers le haut (supports) et deux points ou il a ete repousse vers le bas (resistances). Comparez votre lecture avec le comparateur en ajoutant BCP pour voir si les niveaux bancaires se correlent.
Pourquoi ATW pour apprendre
ATW cumule environ 146 milliards MAD de capitalisation et un volume moyen de ~48 104 titres/jour (fiche Casabourse, juin 2026). Les niveaux y sont ” respectes ” plus souvent que sur une small cap illiquide, car les ordres institutionnels se concentrent aux memes zones. C’est un terrain d’entrainement fiable pour la cartographie technique.
Carte des niveaux ATW – juin 2026
Le tableau ci-dessous resume les trois zones principales identifiees sur l’historique Casabourse des six derniers mois. Chaque niveau est une fourchette, pas un prix unique.
| Zone | Niveau (MAD) | Type | Nb. tests | Volume au test | Lecture |
|---|---|---|---|---|---|
| Zone A – Support majeur | 648 – 652 MAD (centre 650) | Support | 3 rebonds (fev., mars, mai 2026) | ~22 000 titres/j | Plancher psychologique ; perte nette = signal baissier fort. |
| Zone B – Support intermediaire | 672 – 678 MAD (centre 675) | Support | 4 rebonds (janv. – juin 2026) | ~19 500 titres/j | Zone de rechargement en tendance haussiere ; dernier test juin 2026. |
| Zone C – Resistance majeure | 695 – 705 MAD (centre 700) | Resistance | 2 rejets (avr., mai 2026) | ~24 800 titres/j | Plafond du range actuel ; franchissement durable = nouveau scenario. |
| Zone D – Situation actuelle | ~688 MAD | Entre B et C | – | ~18 200 titres/j | Milieu de range 675-700 : ni achat reflexe, ni vente panique. |
Sources : historique quotidien Casabourse (wp_bourse_price_history), clotures ajustees. Les fourchettes integrent les meches et les corps de bougies.
Schema du range actuel
ATW evolue dans un couloir 675 – 700 MAD depuis janvier 2026. Le support a 650 MAD reste une ligne de derniere defense en dessous. Tant que le cours reste entre 675 et 700 MAD, le range n’est pas ” resolu ” : c’est une zone d’attente, pas un signal automatique.
Comment utiliser la carte – trois scenarios
- Scenario haussier : ATW franchit 700 MAD avec volume superieur a 20 000 titres/j et maintien deux seances. Objectif suivant : zone 720-730 MAD (resistance historique).
- Scenario baissier : ATW perd 675 MAD avec volume. Prochain support : 650 MAD. En dessous : scenario de correction plus profonde vers 630 MAD.
- Scenario neutre : le cours reste entre 675 et 700 MAD – pas d’action technique obligatoire ; surveiller les resultats trimestriels et le contexte macro BAM.
Erreurs frequentes sur les supports/resistances
- Trait unique : un support est une zone (ex. 648-652), pas 650,00 au centime pres.
- Oubli du volume : un rebond sans volume est moins fiable qu’un rebond avec 22 000 titres/j.
- Ignorer le fondamental : si ATW publie un resultat decevant, un support technique peut ceder malgre trois rebonds passes.
- Confondre support et objectif d’achat : un support confirme une zone d’interet ; l’entree necessite un plan (prix, taille, invalidation).
Grille de validation – trois tests avant d’agir
| Test | ATW | BCP | Cosumar |
|---|---|---|---|
| Volume moyen/jour | ~18 200 | ~8 130 | ~78 743 |
| Amplitude range 6 mois | ~8 % (675-700) | ~12 % | ~15 % |
| Niveaux ” propres “ | Oui – carte 650/675/700 | Correle banques | Plus volatile – moins ideal pour debuter |
Conclusion : apprenez la cartographie sur ATW, validez sur BCP (meme secteur), puis testez sur Cosumar pour sentir une valeur plus volatile. Le comparateur aligne les trois en un clic.
Choisissez la bonne réponse pour chaque question et consultez votre résultat à la fin.
La réponse attendue privilégie une décision structurée : faits, méthode, risque et cohérence avec le portefeuille.
La réponse attendue privilégie une décision structurée : faits, méthode, risque et cohérence avec le portefeuille.
La réponse attendue privilégie une décision structurée : faits, méthode, risque et cohérence avec le portefeuille.
La réponse attendue privilégie une décision structurée : faits, méthode, risque et cohérence avec le portefeuille.
La réponse attendue privilégie une décision structurée : faits, méthode, risque et cohérence avec le portefeuille.
الدعم والمقاومة: قواعد السعر
الدعم منطقة يدخل فيها المشترون تاريخياً فيرتد السعر. والمقاومة عكسه: فالبائعون يحجبون الصعود. وعلى Casabourse، هذه المستويات ليست خطوطاً سحرية — بل مناطق احتمال مبنية على ارتدادات سابقة وحجم ونفسية جماعية.
حالة عملية في BVC: افتح بطاقة التجاري وفا بنك على Casabourse. وقرّب على آخر ستة أشهر. وحدّد ثلاث نقاط على الأقل ارتد فيها السعر صعوداً (دعوم) ونقطتين رُفض فيهما نزولاً (مقاومات). وقارن قراءتك بـ المُقارِن بإضافة BCP لرؤية ارتباط مستويات البنوك.
لماذا ATW للتعلّم؟
تجمع ATW نحو 146 مليار درهم قيمة سوقية ومتوسط حجم ~48,104 سهم/يوم (بطاقة Casabourse، يونيو 2026). وتُحترم فيها المستويات أكثر من قيمة صغيرة قليلة السيولة (small cap)، لأن أوامر المؤسسات تتجمّع في المناطق نفسها. وهي أرضية تدريب موثوقة للخريطة الفنية.
خريطة مستويات ATW — يونيو 2026
يلخّص الجدول أدناه ثلاث مناطق رئيسية من تاريخ Casabourse لآخر ستة أشهر. وكل مستوى نطاق، لا سعر واحد.
| المنطقة | المستوى (درهم) | النوع | عدد الاختبارات | الحجم عند الاختبار | القراءة |
|---|---|---|---|---|---|
| المنطقة A — دعم رئيسي | 648 – 652 درهم (مركز 650) | دعم | 3 ارتدادات (فبراير، ومارس، وماي 2026) | ~22,000 سهم/ي | أرضية نفسية؛ وخسارتها صافيةً = إشارة هابطة قوية. |
| المنطقة B — دعم متوسط | 672 – 678 درهم (مركز 675) | دعم | 4 ارتدادات (يناير – يونيو 2026) | ~19,500 سهم/ي | منطقة إعادة شحن في اتجاه صاعد؛ وآخر اختبار يونيو 2026. |
| المنطقة C — مقاومة رئيسية | 695 – 705 درهم (مركز 700) | مقاومة | رفضان (أبريل، وماي 2026) | ~24,800 سهم/ي | سقف النطاق الحالي؛ واختراق دائم = سيناريو جديد. |
| المنطقة D — الوضع الحالي | ~688 درهم | بين B و C | – | ~18,200 سهم/ي | وسط نطاق 675-700: لا شراء انعكاسي ولا بيع ذعر. |
المصادر: تاريخ يومي Casabourse (wp_bourse_price_history)، وإغلاقات معدّلة. والنطاقات تشمل الفتيل والأجسام.
مخطط النطاق الحالي
تتحرك ATW في ممر 675 – 700 درهم منذ يناير 2026. ويبقى الدعم عند 650 درهم خط الدفاع الأخير. وما دام السعر بين 675 و700، فالنطاق «غير محسوم»: منطقة انتظار، لا إشارة تلقائية.
كيفية استخدام الخريطة — ثلاثة سيناريوهات
- سيناريو صاعد: تخترق ATW 700 درهم بحجم فوق 20,000 سهم/ي وثبات جلستين. والهدف التالي: 720-730 درهم (مقاومة تاريخية).
- سيناريو هابط: تفقد ATW 675 درهم بحجم. والدعم التالي: 650 درهم. وتحته: تصحيح أعمق نحو 630 درهم.
- سيناريو محايد: السعر بين 675 و700 — لا إجراء فني إلزامي؛ راقب النتائج الفصلية والسياق الكلي لبنك المغرب.
أخطاء شائعة في الدعم/المقاومة
- خط واحد: الدعم منطقة (مثلاً 648-652)، لا 650,00 درهم بالضبط.
- نسيان الحجم: ارتداد بلا حجم أقل موثوقية من ارتداد بـ 22,000 سهم/ي.
- تجاهل الأساسي: فإذا نشرت ATW نتيجة مخيبة، قد ينهار دعم فني رغم ثلاث ارتدادات.
- خلط الدعم بهدف الشراء: الدعم يؤكد منطقة اهتمام؛ والدخول يحتاج خطة (سعر، وحجم، وإبطال).
شبكة التحقق — ثلاثة اختبارات قبل التصرف
| الاختبار | ATW | BCP | Cosumar |
|---|---|---|---|
| متوسط الحجم/يوم | ~18,200 | ~8,130 | ~78,743 |
| سعة النطاق 6 أشهر | ~8% (675-700) | ~12% | ~15% |
| مستويات «نظيفة» | نعم — خريطة 650/675/700 | مرتبط بالبنوك | أكثر تقلباً — أقل مثالية للبدء |
الخلاصة: تعلّم الخريطة على ATW، وتحقّق على BCP (نفس القطاع)، ثم جرّب Cosumar لقيمة أكثر تقلباً. والمُقارِن يوازي الثلاث بنقرة.
اختر الإجابة الصحيحة لكل سؤال واطلع على نتيجتك في النهاية.
الخريطة تحدد دعمين (650 و675) ومقاومة رئيسية (700 درهم).
كسر دعم + حجم = تأكيد؛ و650 درهم الهدف التالي.
الارتدادات التاريخية تُشكّل مناطق؛ ومعاملة 650 كنطاق تتجنب إشارات كاذبة.
اختراق دائم لمقاومة 700 بحجم يفتح ممراً صاعداً جديداً.
ATW (~48,104 سهم/ي، ~146 مليار قيمة سوقية) تقدّم مستويات موثوقة للتدريب.
Support and resistance: the grammar of price
A support is a zone where buyers have historically stepped in: the price bounces. A resistance is the opposite: sellers have blocked the rally. On Casabourse, these levels are not magic lines — they are probability zones built from past bounces, volume and collective psychology.
BVC practical case: open the Attijariwafa Bank page on Casabourse. Zoom in on the last six months. Spot at least three points where the price bounced higher (supports) and two where it was pushed back down (resistances). Compare your reading with the comparator by adding BCP to see whether bank levels correlate.
Why ATW for learning
ATW has roughly 146 billion MAD of market cap and average volume of ~48,104 shares/day (Casabourse data, June 2026). Levels are respected more often than on an illiquid small cap, because institutional orders cluster in the same zones. It is a reliable training ground for technical mapping.
ATW level map — June 2026
The table below summarises the three main zones identified on Casabourse history over the last six months. Each level is a range, not a single price.
| Zone | Level (MAD) | Type | Tests | Volume at test | Reading |
|---|---|---|---|---|---|
| Zone A — Major support | 648 – 652 MAD (midpoint 650) | Support | 3 bounces (Feb., Mar., May 2026) | ~22,000 shares/day | Psychological floor; a clean break = strong bearish signal. |
| Zone B — Intermediate support | 672 – 678 MAD (midpoint 675) | Support | 4 bounces (Jan. – Jun. 2026) | ~19,500 shares/day | Reload zone in an uptrend; last test June 2026. |
| Zone C — Major resistance | 695 – 705 MAD (midpoint 700) | Resistance | 2 rejections (Apr., May 2026) | ~24,800 shares/day | Ceiling of the current range; a sustained break = new scenario. |
| Zone D — Current situation | ~688 MAD | Between B and C | – | ~18,200 shares/day | Mid-range 675–700: neither reflex buy nor panic sell. |
Sources: Casabourse daily history (wp_bourse_price_history), adjusted closes. Ranges include wicks and candle bodies.
Current range schematic
ATW has traded in a 675 – 700 MAD corridor since January 2026. Support at 650 MAD remains the last line of defence below. As long as the price stays between 675 and 700 MAD, the range is not “resolved”: it is a waiting zone, not an automatic signal.
How to use the map — three scenarios
- Bullish scenario: ATW breaks 700 MAD with volume above 20,000 shares/day and holds for two sessions. Next target: 720–730 MAD zone (historical resistance).
- Bearish scenario: ATW loses 675 MAD on volume. Next support: 650 MAD. Below that: a deeper correction toward 630 MAD.
- Neutral scenario: price stays between 675 and 700 MAD — no mandatory technical action; watch quarterly results and BAM macro context.
Common support/resistance mistakes
- Single line: a support is a zone (e.g. 648–652), not 650.00 to the centime.
- Forgetting volume: a bounce without volume is less reliable than one with 22,000 shares/day.
- Ignoring fundamentals: if ATW posts disappointing results, a technical support can fail despite three past bounces.
- Confusing support with buy target: a support confirms a zone of interest; entry still needs a plan (price, size, invalidation).
Validation grid — three tests before you act
| Test | ATW | BCP | Cosumar |
|---|---|---|---|
| Average volume/day | ~18,200 | ~8,130 | ~78,743 |
| 6-month range amplitude | ~8 % (675–700) | ~12 % | ~15 % |
| “Clean” levels | Yes — 650/675/700 map | Correlates with banks | More volatile — less ideal for beginners |
Conclusion: learn mapping on ATW, validate on BCP (same sector), then test on Cosumar to feel a more volatile stock. The comparator lines up all three in one click.
Practical exercise on Casabourse
Open Attijariwafa Bank. Draw three horizontal lines: 650 MAD (major support), 675 MAD (intermediate support), 700 MAD (resistance). Shade the 675–700 MAD zone in grey (current range). Note the volume on sessions that touch each level. Write: “if ATW closes below 675 MAD with volume > 20,000, I revisit my thesis”.
Key takeaways
- Support = historical buy zone; resistance = historical sell zone.
- ATW: supports at 650 and 675 MAD, resistance at 700 MAD — range 675–700 in June 2026.
- Levels are zones, not exact prices; volume confirms or denies.
- Technical mapping helps with timing; the fundamental thesis stays primary.
- Use the Casabourse comparator to compare ATW with other banks (BCP, CIH).
Self-check
- What are the three key levels on the ATW map?
- What happens if ATW clearly loses 675 MAD on volume?
- Why is a support a zone and not a single price?
- Which scenario kicks in if ATW breaks 700 MAD and holds?
- Why is ATW a good stock for learning support/resistance?