
Analyse Technique : Lire un graphique
شمعة بشمعة — اتصالات المغرب (IAM)
Candle by candle: IAM
Traduction en cours — contenu affiché en français.
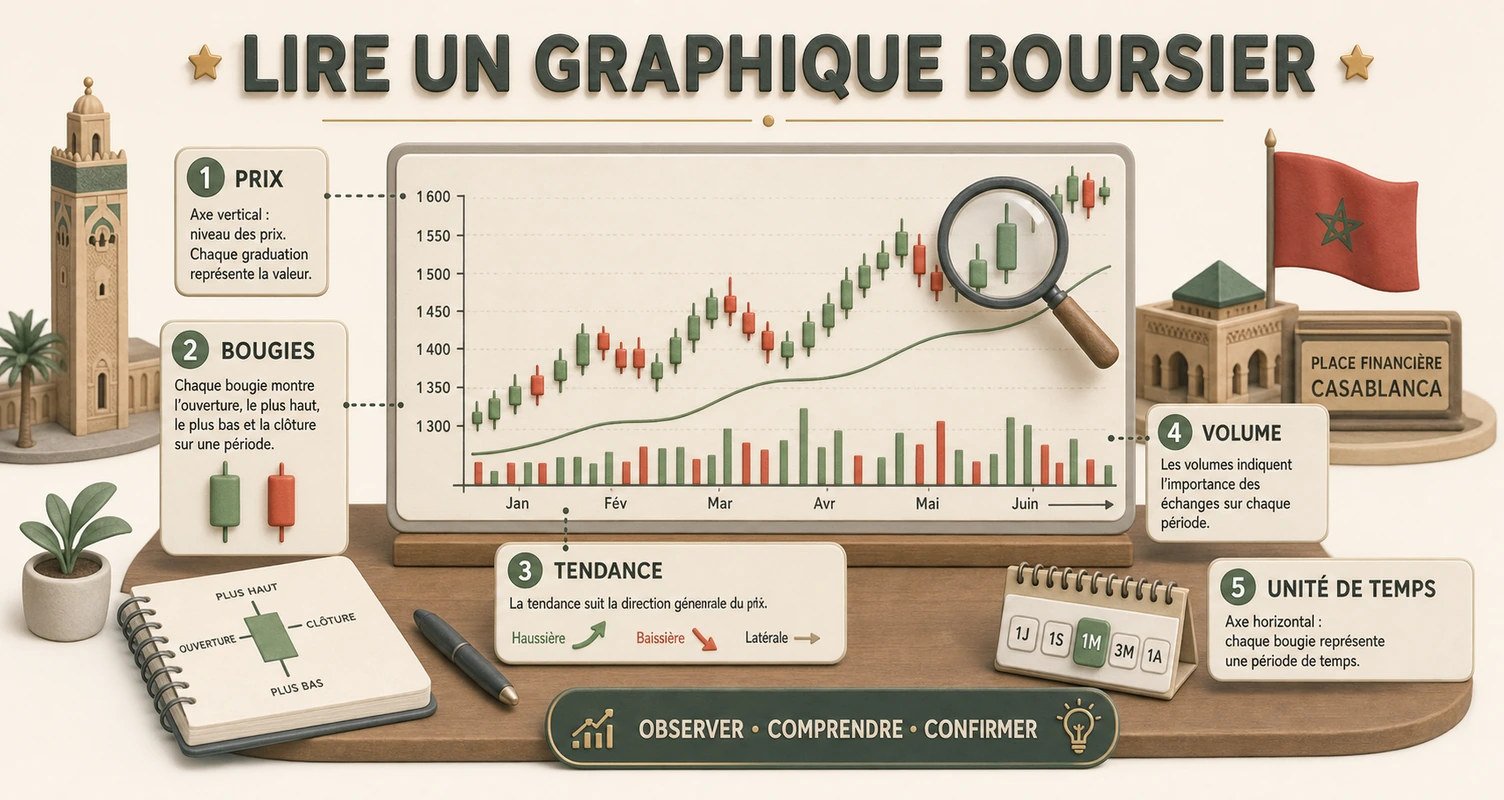
Pourquoi commencer par IAM en hebdomadaire
Sur la Bourse de Casablanca, beaucoup de debutants ouvrent un graphique quotidien et voient du bruit. Le hebdomadaire filtre les annonces du jour et met en evidence la structure : tendance, zone de consolidation, rejet de niveau. IAM est un cas pedagogique ideal : liquidite elevee, dividende regulier, faible volatilite relative – les bougies se lisent sans que le carnet d’ordres deforme chaque meche.
cas pratique BVC : avant de lire les bougies, ouvrez la fiche Maroc Telecom sur Casabourse et passez en graphique hebdomadaire. Reperez la cloture de la derniere semaine (~91,4 MAD) et le volume cumule de la semaine. Comparez ensuite avec une valeur illiquide via le comparateur pour sentir la difference de fiabilite des chandeliers.
Anatomie d’une bougie – le vocabulaire minimal
- Corps : distance entre ouverture et cloture. Vert (haussier) si cloture > ouverture ; rouge (baissier) sinon.
- Meche haute : plus haut de la semaine moins le haut du corps – pression vendeuse intrasemaine.
- Meche basse : bas du corps moins le plus bas – pression acheteuse intrasemaine.
- Cloture : le chiffre qui compte pour la semaine suivante ; sur IAM, c’est la reference institutionnelle.
Regle d’or a Casablanca : une seule bougie isolee ne valide rien. Trois bougies consecutives dans la meme zone commencent a raconter une histoire.
Carnet de lecture – cinq semaines IAM (donnees Casabourse, ref. juin 2026)
Le tableau ci-dessous retrace cinq bougies hebdomadaires consecutives sur IAM. Les prix sont des clotures hebdomadaires arrondies issues de l’historique Casabourse ; le volume est la moyenne journaliere de la periode.
| Semaine | Ouverture | Cloture | Plus haut | Plus bas | Volume moy. (titres/j) | Lecture bougie |
|---|---|---|---|---|---|---|
| S1 – mi-mai 2026 | 89,8 MAD | 90,6 MAD | 91,1 MAD | 89,2 MAD | 42 300 | Petit corps haussier ; meche haute courte – acheteurs en controle modere. |
| S2 – fin mai 2026 | 90,6 MAD | 91,9 MAD | 92,4 MAD | 90,1 MAD | 45 800 | Corps haussier plus large ; franchissement net de 91 MAD – momentum positif. |
| S3 – debut juin 2026 | 91,9 MAD | 91,2 MAD | 92,8 MAD | 90,8 MAD | 48 200 | Doji-like : longue meche haute (92,8), cloture sous l’ouverture – rejet vendeur au-dessus de 92 MAD. |
| S4 – mi-juin 2026 | 91,2 MAD | 90,5 MAD | 91,6 MAD | 90,1 MAD | 41 600 | Bougie baissiere ; corps moyen – correction apres l’echec a 92,8 MAD. |
| S5 – semaine en cours | 90,5 MAD | ~91,4 MAD | 91,9 MAD | 90,3 MAD | 44 070 | Reprise haussiere ; corps haussier qui reprend la zone 91 MAD – pas encore de breakout de 92,8. |
Sources : historique hebdomadaire Casabourse (wp_bourse_price_history), volumes journaliers moyennes. Les dates sont des semaines de bourse ou le niveau est atteint.
La sequence en une phrase
Entre 89,2 et 92,8 MAD, IAM dessine une consolidation haussiere legere : deux semaines de progression, un rejet a 92,8 MAD (meche haute S3), une correction a 90,5 MAD, puis reprise vers 91,4 MAD. Tant que la cloture hebdomadaire reste au-dessus de 90 MAD, le biais reste neutre a legerement haussier.
Patterns reperes sur ces cinq bougies
- Rejet de 92,8 MAD (S3) : meche haute longue + cloture baissiere = les vendeurs ont refuse le niveau. Ce n’est pas un signal de vente seul, mais une zone a surveiller.
- Support teste a 90,1 MAD (S4) : le plus bas de la semaine 4 n’a pas casse 90 MAD – les acheteurs defendent la zone.
- Absence de volume anormal : entre 41 600 et 48 200 titres/jour, le volume reste dans la norme IAM. Pas de spike emotionnel (contrairement a des valeurs comme Addoha en avril 2026).
Ce que les bougies ne disent PAS
Les chandeliers ne remplacent pas l’analyse fondamentale. Maroc Telecom publie des resultats trimestriels, verse un dividende stable (~4,4 % de rendement), et depend du marche domestique et africain. Une bougie haussiere ne compense pas une deceleration du chiffre d’affaires. Utilisez le comparateur Casabourse pour confronter IAM a Attijariwafa Bank ou Cosumar sur le plan fondamental avant d’agir.
Choisissez la bonne réponse pour chaque question et consultez votre résultat à la fin.
La réponse attendue privilégie une décision structurée : faits, méthode, risque et cohérence avec le portefeuille.
La réponse attendue privilégie une décision structurée : faits, méthode, risque et cohérence avec le portefeuille.
La réponse attendue privilégie une décision structurée : faits, méthode, risque et cohérence avec le portefeuille.
La réponse attendue privilégie une décision structurée : faits, méthode, risque et cohérence avec le portefeuille.
La réponse attendue privilégie une décision structurée : faits, méthode, risque et cohérence avec le portefeuille.
لماذا نبدأ بـ IAM في الإطار الأسبوعي؟
على بورصة الدار البيضاء، يفتح كثير من المبتدئين الرسم اليومي فلا يرون سوى الضجيج. أما الأسبوعي فيصفّي إعلانات اليوم ويبرز البنية: الاتجاه، ومنطقة التجمّع، ورفض المستوى. وIAM حالة تعليمية مثالية: سيولة عالية، وتوزيع أرباح منتظم، وتقلب نسبي منخفض — فتُقرأ الشموع دون أن يشوّه دفتر الأوامر كل فتيل.
حالة عملية في BVC: قبل قراءة الشموع، افتح بطاقة اتصالات المغرب على Casabourse وانتقل إلى الرسم الأسبوعي. حدّد إغلاق آخر أسبوع. ثم قارنه بقيمة قليلة السيولة عبر المُقارِن لتستشعر الفرق في موثوقية الشموع.
تشريح الشمعة — المفردات الأساسية
- الجسم: المسافة بين الافتتاح والإغلاق. أخضر (صاعد) إذا كان الإغلاق > الافتتاح؛ وأحمر (هابط) في خلاف ذلك.
- الفتيل العلوي: أعلى الأسبوع ناقص أعلى الجسم — ضغط بيع داخل الأسبوع.
- الفتيل السفلي: أسفل الجسم ناقص أدنى الأسبوع — ضغط شراء داخل الأسبوع.
- الإغلاق: الرقم الذي يهم للأسبوع التالي؛ وعلى IAM، هو المرجع المؤسسي.
وقاعدة ذهبية في الدار البيضاء: شمعة واحدة معزولة لا تثبت شيئاً، وثلاث شموع متتالية في المنطقة نفسها تبدأ في سرد قصة.
دفتر قراءة — خمسة أسابيع IAM (بيانات Casabourse، مرجع يونيو 2026)
يعيد الجدول أدناه خمس شموع أسبوعية متتالية على IAM. والأسعار إغلاقات أسبوعية مقرّبة من تاريخ Casabourse؛ والحجم متوسط يومي للفترة.
| الأسبوع | الافتتاح | الإغلاق | الأعلى | الأدنى | متوسط الحجم (سهم/ي) | قراءة الشمعة |
|---|---|---|---|---|---|---|
| S1 — منتصف ماي 2026 | 89,8 درهم | 90,6 درهم | 91,1 درهم | 89,2 درهم | 42,300 | جسم صاعد صغير؛ وفتيل علوي قصير — المشترون يسيطرون باعتدال. |
| S2 — نهاية ماي 2026 | 90,6 درهم | 91,9 درهم | 92,4 درهم | 90,1 درهم | 45,800 | جسم صاعد أوسع؛ وتجاوز واضح لـ 91 درهم — زخم إيجابي. |
| S3 — بداية يونيو 2026 | 91,9 درهم | 91,2 درهم | 92,8 درهم | 90,8 درهم | 48,200 | شبه doji: فتيل علوي طويل (92,8)، وإغلاق تحت الافتتاح — رفض بائع فوق 92 درهم. |
| S4 — منتصف يونيو 2026 | 91,2 درهم | 90,5 درهم | 91,6 درهم | 90,1 درهم | 41,600 | شمعة هابطة؛ وجسم متوسط — تصحيح بعد الفشل عند 92,8 درهم. |
| S5 — الأسبوع الجاري | 90,5 درهم | ~91,4 درهم | 91,9 درهم | 90,3 درهم | 44,070 | عودة صاعدة؛ جسم صاعد يستعيد منطقة 91 درهم — لم يُكسر 92,8 بعد. |
المصادر: تاريخ أسبوعي Casabourse (wp_bourse_price_history)، ومتوسطات حجم يومية. والتواريخ أسابيع بورصية يُبلغ فيها المستوى.
التسلسل في جملة واحدة
بين 89,2 و92,8 درهم، ترسم IAM تجمّعاً صاعداً خفيفاً: أسبوعان تقدّم، ورفض عند 92,8 درهم (فتيل S3)، وتصحيح إلى 90,5 درهم، ثم عودة نحو 91,4 درهم. وما دام الإغلاق الأسبوعي فوق 90 درهم، يبقى الميل محايداً إلى صاعد قليلاً.
أنماط مُحددة على هذه الشموع الخمس
- رفض 92,8 درهم (S3): فتيل علوي طويل + إغلاق هابط = البائعون رفضوا المستوى. وهي ليست إشارة بيع وحدها، بل منطقة للمراقبة.
- دعم مُختبر عند 90,1 درهم (S4): أدنى الأسبوع 4 لم يكسر 90 درهم — المشترون يدافعون عن المنطقة.
- غياب حجم غير طبيعي: بين 41,600 و48,200 سهم/يوم، يبقى الحجم ضمن المعتاد لـ IAM. لا قفزة عاطفية (بخلاف قيم مثل Addoha في أبريل 2026).
ما لا تقوله الشموع
الشموع لا تُغني عن التحليل الأساسي. فـاتصالات المغرب تنشر نتائج فصلية، وتوزّع أرباحاً مستقرة (~4,4% عائد)، وتعتمد على السوق المحلي والأفريقي. وشمعة صاعدة لا تعوّض تباطؤ الإيرادات. واستخدم المُقارِن على Casabourse لمواجهة IAM بـ التجاري وفا بنك أو كوسومار أساسياً قبل التصرف.
اختر الإجابة الصحيحة لكل سؤال واطلع على نتيجتك في النهاية.
S3 يعرض فتيلاً علوياً طويلاً (92,8) وإغلاقاً هابطاً — علامة كلاسيكية لرفض بائع فوق 92 درهم.
في S4، ينزل السعر إلى 90,1 درهم لكن لا يُغلق تحت 90 — فالدعم محافَظ عليه.
الإطار الأسبوعي يُنعّم تقلبات اليوم ويجعل الشموع أوضح.
الفتيل العلوي يُظهر الرفض؛ والإغلاق الهابط يؤكد أن البائعين فازوا بالأسبوع.
شمعة صاعدة لا تعوّض تقييماً مبالغاً فيه أو أطروحة أساسية مكسورة.
Why start with IAM on the weekly chart
On the Casablanca Stock Exchange, many beginners open a daily chart and see noise. The weekly filters day-to-day headlines and highlights structure: trend, consolidation zone, rejection of a level. IAM is an ideal teaching case: high liquidity, regular dividend, relatively low volatility — candles read cleanly without the order book distorting every wick.
Practical exercise on the BVC: before reading candles, open the Maroc Telecom page on Casabourse and switch to the weekly chart. Locate the last week’s close (~91.4 MAD) and the week’s cumulative volume. Then compare with an illiquid name via the comparator to feel the difference in candle reliability.
Anatomy of a candle — minimal vocabulary
- Body: distance between open and close. Green (bullish) if close > open; red (bearish) otherwise.
- Upper wick: week’s high minus top of body — intraweek selling pressure.
- Lower wick: bottom of body minus week’s low — intraweek buying pressure.
- Close: the number that matters for the following week; on IAM, it is the institutional reference.
Golden rule in Casablanca: a single isolated candle proves nothing. Three consecutive candles in the same zone begin to tell a story.
Reading log — five IAM weeks (Casabourse data, ref. June 2026)
The table below retraces five consecutive weekly candles on IAM. Prices are rounded weekly closes from Casabourse history; volume is the period’s average daily volume.
| Week | Open | Close | High | Low | Avg. volume (shares/day) | Candle reading |
|---|---|---|---|---|---|---|
| W1 — mid-May 2026 | 89.8 MAD | 90.6 MAD | 91.1 MAD | 89.2 MAD | 42,300 | Small bullish body; short upper wick — buyers in moderate control. |
| W2 — late May 2026 | 90.6 MAD | 91.9 MAD | 92.4 MAD | 90.1 MAD | 45,800 | Larger bullish body; clear break above 91 MAD — positive momentum. |
| W3 — early June 2026 | 91.9 MAD | 91.2 MAD | 92.8 MAD | 90.8 MAD | 48,200 | Doji-like: long upper wick (92.8), close below open — seller rejection above 92 MAD. |
| W4 — mid-June 2026 | 91.2 MAD | 90.5 MAD | 91.6 MAD | 90.1 MAD | 41,600 | Bearish candle; medium body — pullback after failure at 92.8 MAD. |
| W5 — current week | 90.5 MAD | ~91.4 MAD | 91.9 MAD | 90.3 MAD | 44,070 | Bullish recovery; bullish body retaking the 91 MAD zone — no breakout of 92.8 yet. |
Sources: Casabourse weekly history (wp_bourse_price_history), average daily volumes. Dates are trading weeks when the level was reached.
The sequence in one sentence
Between 89.2 and 92.8 MAD, IAM draws a mild bullish consolidation: two weeks of progress, rejection at 92.8 MAD (W3 upper wick), pullback to 90.5 MAD, then recovery toward 91.4 MAD. As long as the weekly close stays above 90 MAD, bias remains neutral to slightly bullish.
Patterns spotted on these five candles
- Rejection at 92.8 MAD (W3): long upper wick + bearish close = sellers refused the level. Not a standalone sell signal, but a zone to watch.
- Support tested at 90.1 MAD (W4): week 4 low did not break 90 MAD — buyers defended the zone.
- No abnormal volume: between 41,600 and 48,200 shares/day, volume stays within IAM’s normal range. No emotional spike (unlike names such as Addoha in April 2026).
What candles do NOT tell you
Candlesticks do not replace fundamental analysis. Maroc Telecom publishes quarterly results, pays a stable dividend (~4.4% yield), and depends on domestic and African markets. A bullish candle does not offset slowing revenue. Use the Casabourse comparator to compare IAM with Attijariwafa Bank or Cosumar on fundamentals before acting.
Exercise on Casabourse
Open IAM on the weekly chart. Identify the last five candles and fill in the table yourself (open, close, high, low). Draw a horizontal line at 92.8 MAD (W3 rejection) and another at 90 MAD (support). Note: “if the weekly close breaks below 90 MAD, my bullish scenario is invalid”.
Key takeaways
- The weekly chart filters daily noise — ideal for starting on the Casablanca Stock Exchange.
- Body = balance of power; wicks = intraweek rejections; close = reference for the next week.
- One candle is not enough: read the sequence (here: rise, rejection, pullback, recovery).
- IAM (~91.4 MAD, vol ~44,070/day) offers reliable candles thanks to its liquidity.
- Candles help with timing; the fundamental thesis stays priority.
Self-check
- Which weekly IAM candle shows a clear rejection above 92 MAD?
- Which support level was tested in week 4 without breaking 90 MAD?
- Why is the weekly preferred to the daily for a beginner on IAM?
- What does a long upper wick with a bearish close mean?
- Why cross-check candle reading with the Casabourse comparator?