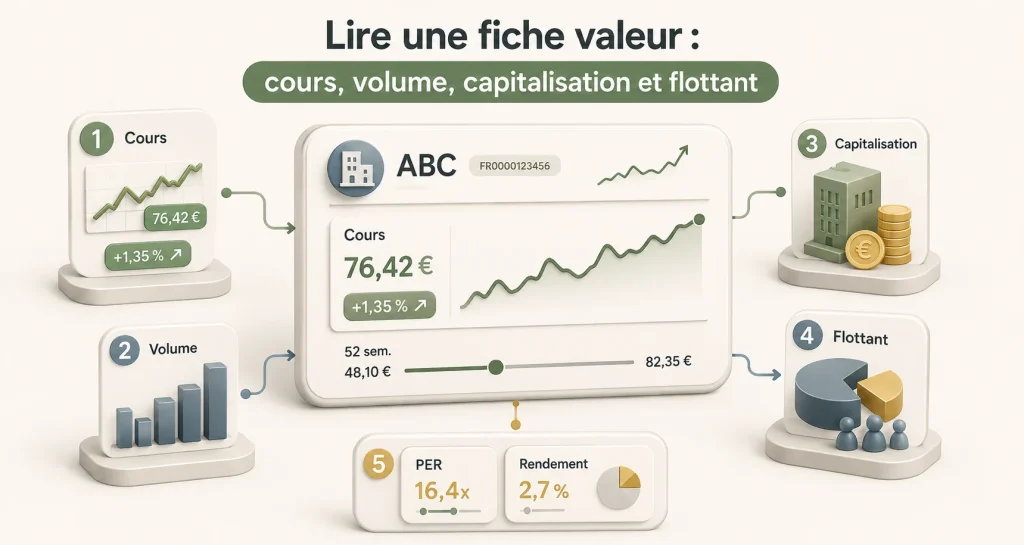
Lire une fiche valeur : cours, volume, capitalisation et flottant
قراءة بطاقة القيمة: السعر، الحجم، القيمة السوقية والأسهم الحرة
Reading a stock page: price, volume, market cap and free float
Traduction en cours — contenu affiché en français.
Pourquoi commencer par la fiche valeur ?
Avant d’ouvrir un RFA de 200 pages, la fiche valeur vous donne l’essentiel en un coup d’œil : prix, taille, liquidite, valorisation et revenu. C’est le premier ecran a consulter sur Casabourse pour toute valeur de la Bourse de Casablanca – que ce soit IAM, ATW ou Addoha.
Decortiquer IAM – parcours champ par champ
Ouvrez la fiche Maroc Telecom sur Casabourse. Voici ce que chaque zone vous dit (donnees de reference, juin 2026) :
| Champ fiche | Valeur IAM | Ce que ca signifie | Reflexe debutant |
|---|---|---|---|
| Dernier cours | 91,4 MAD | Dernier prix auquel IAM a ete echangee (fixing de cloture ou dernier trade en continu) | Comparez au plus haut/bas 52 semaines pour situer le cours dans sa fourchette annuelle |
| Variation jour | ex. +0,6 % | Mouvement par rapport a la cloture de la veille | Une variation d’un jour ne dit rien sur la qualite de la societe – regardez la tendance |
| Volume seance | 44 070 titres | Nombre d’actions echangees dans la journee | Liquidite elevee : vous pouvez acheter/vendre facilement. Seuil confortable : > 5 000 titres/jour |
| Capitalisation | 80,3 Mds MAD | Cours × nombre total d’actions = taille boursiere de la societe | IAM est la 1re capitalisation de la cote – valeur ” grande cap “, generalement moins volatile |
| Flottant | ~30-35 % (indicatif) | Part des actions reellement disponibles a l’echange (hors Etat et actionnaires de controle) | Flottant modere : l’Etat et filiales detiennent une part importante ; le flottant limite la liquidite theorique |
| PER | ~15-17x (selon BPA 2024) | Cours / benefice par action = combien d’annees de benefice ” coute ” l’action | PER seul ne suffit pas – comparez au secteur telecom et a l’historique IAM dans le comparateur |
| Rendement dividende | ~4,4 % | Dividende annuel / cours × 100. DPS 2024 : ~1,43 MAD | Revenu recurrent interessant – verifiez que le benefice couvre le dividende (payout < 100 %) |
| Plus haut / bas 52 sem. | ex. 82 – 98 MAD | Fourchette de cours sur un an glissant | A 91,4 MAD, IAM est dans le haut de sa fourchette – contexte pour juger si le prix est ” cher ” ou ” bon marche “ |
Source : fiche Maroc Telecom sur Casabourse. Recalculez au jour de lecture – les cours evoluent chaque seance.
Zoom : le cours et la capitalisation
Le cours de 91,4 MAD multiplie par le nombre d’actions en circulation donne la capitalisation de 80,3 milliards MAD. C’est la ” taille ” de Maroc Telecom aux yeux du marche. Pour comparaison : ATW affiche ~146 Mds et BCP ~49 Mds sur Casabourse. IAM est donc la 2e ou 3e valeur de la cote selon les seances.
Zoom : le volume et la liquidite
44 070 titres echanges par jour, c’est l’un des volumes les plus eleves de la Bourse de Casablanca. Concretement : si vous achetez 50 actions IAM (~4 570 MAD), votre ordre represente moins de 0,2 % du volume journalier — il sera execute sans deplacer le cours. Comparez avec Disway (~59 titres/jour) : la, 50 actions peuvent representer la quasi-totalite d’une seance. Un volume eleve reduit le risque d’execution difficile ; c’est un critere technique a lire sur la fiche, pas un conseil d’achat sur IAM.
Zoom : PER et dividende
Le PER ~15-17x signifie que le marche paie 15 a 17 dirhams pour chaque dirham de benefice annuel d’IAM. C’est raisonnable pour une telecom mature a croissance moderee. Le rendement dividende ~4,4 % (DPS 1,43 MAD / cours 91,4) en fait une valeur de revenu : vous touchez environ 4,4 % par an en dividendes, hors variation du cours. Verifiez dans le RFA que le benefice couvre le dividende – chez IAM, le payout reste soutenable.
Ce que la fiche ne dit pas (et ou le trouver)
La fiche valeur est une photographie, pas un diagnostic complet. Pour aller plus loin sur Casabourse :
- Compte de resultat / bilan : onglet comptes annuels (CA, EBITDA, resultat net)
- Historique des dividendes : calendrier et montants passes
- Documents AMMC : RFA, communiques de resultats, fiche signaletique
Cas pratique BVC
Ouvrez la fiche IAM sur Casabourse et recopiez les 8 champs du tableau ci-dessus avec les donnees du jour. Puis ouvrez le comparateur et confrontez IAM a BCP : capitalisation, PER, rendement dividende, volume. Laquelle est la plus liquide ? Laquelle offre le meilleur rendement ? La fiche seule ne repond pas – la comparaison oui.
Choisissez la bonne réponse pour chaque question et consultez votre résultat à la fin.
La réponse attendue privilégie une décision structurée : faits, méthode, risque et cohérence avec le portefeuille.
La réponse attendue privilégie une décision structurée : faits, méthode, risque et cohérence avec le portefeuille.
La réponse attendue privilégie une décision structurée : faits, méthode, risque et cohérence avec le portefeuille.
La réponse attendue privilégie une décision structurée : faits, méthode, risque et cohérence avec le portefeuille.
La réponse attendue privilégie une décision structurée : faits, méthode, risque et cohérence avec le portefeuille.
لماذا نبدأ ببطاقة القيمة؟
قبل أن تفتح تقريراً مالياً سنوياً من 200 صفحة، تمنحك بطاقة القيمة الأساسَ في لمحة: السعر، والحجم، والسيولة، والتقييم، والدخل. وهي أول شاشة تطّلع عليها على Casabourse لأي قيمة في بورصة الدار البيضاء — سواء IAM أو ATW أو Addoha.
تشريح IAM — حقلاً بحقل
افتح بطاقة اتصالات المغرب على Casabourse، وإليك ما يخبرك به كل قسم (بيانات مرجعية، يونيو 2026):
| حقل البطاقة | قيمة IAM | المعنى | العادة الصحيحة |
|---|---|---|---|
| آخر سعر | 91,4 درهم | آخر سعر تداوُل لـ IAM (fixing الإغلاق أو آخر صفقة في السوق المستمر) | قارنه بأعلى/أدنى سعر في 52 أسبوعاً لتحدّد موقعه ضمن نطاقه السنوي |
| تغير اليوم | مثلاً +0,6% | الحركة مقارنةً بإغلاق الأمس | تغيّر يوم واحد لا يقول شيئاً عن جودة الشركة؛ انظر إلى الاتجاه |
| حجم الجلسة | 44,070 سهم | عدد الأسهم المتداولة في اليوم | سيولة عالية تعني شراءً وبيعاً بسهولة؛ والعتبة المريحة > 5,000 سهم/يوم |
| القيمة السوقية | 80,3 مليار درهم | السعر × إجمالي الأسهم = حجم الشركة في السوق | IAM من أكبر القيم («large cap»)، وهي أقل تقلباً في العادة |
| الأسهم الحرة (flottant) | ~30–35% (إرشادي) | جزء الأسهم المتاح فعلياً للتداول (باستثناء الدولة والمساهمين المسيطرين) | أسهم حرة معتدلة: تملك الدولة والشركات التابعة حصة كبيرة، مما يحدّ من السيولة النظرية |
| PER | ~15–17x (حسب BPA 2024) | السعر ÷ ربح السهم = كم سنةً من الأرباح «يكلّفك» السهم | PER وحده لا يكفي؛ قارنه بقطاع الاتصالات وبتاريخ IAM في المُقارِن |
| عائد التوزيع | ~4,4% | التوزيع السنوي ÷ السعر × 100. وDPS لعام 2024: ~1,43 درهم | دخل متكرر جذّاب؛ تأكّد أن الربح يغطّي التوزيع (payout < 100%) |
| أعلى / أدنى 52 أسبوعاً | مثلاً 82–98 درهم | نطاق السعر خلال سنة متحرّكة | عند 91,4 درهم تكون IAM في الجزء الأعلى من نطاقها — سياق يساعدك على الحكم: «غالية» أم «رخيصة» |
المصدر: بطاقة اتصالات المغرب على Casabourse. أعِد الحساب يوم قراءتك — فالأسعار تتغير في كل جلسة.
تركيز: السعر والقيمة السوقية
سعر 91,4 درهم مضروباً في عدد الأسهم المتداولة يعطي قيمة سوقية قدرها 80,3 مليار درهم؛ إنه «حجم» اتصالات المغرب في نظر السوق. وللمقارنة: ATW ~146 مليار وBCP ~49 مليار على Casabourse، فـ IAM إذن ثاني أو ثالث قيمة بحسب الجلسات.
تركيز: الحجم والسيولة
يُعدّ حجم 44,070 سهم يومياً من أعلى الأحجام في بورصة الدار البيضاء. وعملياً، فإن شراء 50 سهماً من IAM (~4,570 درهم) يمثّل أقل من 0,2% من حجم اليوم، ويُنفَّذ من دون تحريك السعر. قارن ذلك بـ Disway (~59 سهم/يوم)، حيث قد تمثّل 50 سهماً شبه الجلسة كاملةً. فالحجم المرتفع يقلّل خطر صعوبة التنفيذ؛ وهو معيار تقني على البطاقة، لا نصيحة بشراء IAM.
تركيز: PER والتوزيع
PER ~15–17x يعني أن السوق يدفع 15 إلى 17 درهماً مقابل كل درهم ربح سنوي لـ IAM، وهو مستوى معقول لشركة اتصالات ناضجة ذات نمو معتدل. أما عائد التوزيع ~4,4% (DPS 1,43 ÷ السعر 91,4) فيجعلها قيمة دخل: نحو 4,4% سنوياً من التوزيعات، بمعزل عن تغيّر السعر. وتأكّد في التقرير السنوي من أن الربح يغطّي التوزيع؛ فعند IAM يبقى الـ payout مستداماً.
ما لا تقوله البطاقة (وأين تجده)
بطاقة القيمة لقطة سريعة، لا تشخيص كامل. وللتعمّق أكثر على Casabourse:
- حساب النتائج / الميزانية: تبويب الحسابات السنوية (CA، EBITDA، صافي الربح)
- تاريخ التوزيعات: الرزنامة والمبالغ السابقة
- وثائق AMMC: التقرير السنوي، وبلاغات النتائج، والبطاقة التعريفية
حالة عملية في BVC
افتح بطاقة IAM على Casabourse وانسخ الحقول الثمانية من الجدول ببيانات اليوم. ثم افتح المُقارِن وقارِن IAM بـ BCP من حيث القيمة السوقية وPER وعائد التوزيع والحجم. أيّهما أكثر سيولة؟ وأيّهما يقدّم عائداً أفضل؟ البطاقة وحدها لا تجيب، أما المقارنة فنعم.
اختر الإجابة الصحيحة لكل سؤال واطلع على نتيجتك في النهاية.
تعرض IAM (اتصالات المغرب) سعراً ~91,4 درهم بقيمة سوقية ~80,3 مليار — أول أو ثاني قيمة. أما ATW (~680 درهم) وAddoha (~32 درهم) فقيمتان أخريان.
الحجم المرتفع يعني أن السوق يستوعب الأوامر بسهولة — وهو أساسي للمبتدئ.
PER = السعر ÷ ربح السهم. ومستوى 15–17x معقول لشركة اتصالات ناضجة؛ قارنه بالقطاع.
تستثني الأسهم الحرة ما تملكه الدولة أو المساهمون المسيطرون — وهي تؤثر على السيولة الفعلية.
يجمع Casabourse التقارير السنوية والحسابات السنوية لكل شركة — بعد بيانات السعر.
Why start with the stock page?
Before opening a 200-page annual financial report (RFA), the stock page gives you the essentials at a glance: price, size, liquidity, valuation and income. It is the first screen to check on Casabourse for any Casablanca Stock Exchange stock — whether IAM, ATW or Addoha.
Breaking down IAM — field by field
Open the Maroc Telecom page on Casabourse. Here is what each area tells you (reference data, June 2026):
| Page field | IAM value | What it means | Beginner habit |
|---|---|---|---|
| Last price | 91.4 MAD | Last price at which IAM traded (closing auction fixing or last continuous trade) | Compare to the 52-week high/low to place the price in its annual range |
| Day change | e.g. +0.6 % | Move versus the previous close | A one-day move says nothing about company quality — look at the trend |
| Session volume | 44,070 shares | Number of shares traded that day | High liquidity: you can buy/sell easily. Comfortable threshold: > 5,000 shares/day |
| Market cap | 80.3 bn MAD | Price × total shares = stock market size of the company | IAM is among the largest caps on the exchange — a “large cap”, generally less volatile |
| Free float | ~30–35 % (indicative) | Share of stock actually available to trade (excluding the State and controlling shareholders) | Moderate free float: the State and affiliates hold a large stake; limited float caps theoretical liquidity |
| P/E | ~15–17x (based on 2024 EPS) | Price / earnings per share = how many years of profit the stock “costs” | P/E alone is not enough — compare to the telecom sector and IAM history in the comparator |
| Dividend yield | ~4.4 % | Annual dividend / price × 100. 2024 DPS: ~1.43 MAD | Attractive recurring income — check that earnings cover the dividend (payout < 100 %) |
| 52-week high / low | e.g. 82 – 98 MAD | Price range over a rolling year | At 91.4 MAD, IAM is in the upper part of its range — context for judging whether the price is “expensive” or “cheap” |
Source: Maroc Telecom page on Casabourse. Recalculate on the day you read — prices move every session.
Zoom: price and market cap
The price of 91.4 MAD multiplied by shares outstanding gives market cap of 80.3 billion MAD. That is Maroc Telecom’s “size” in the market’s eyes. For comparison: ATW shows ~146 bn and BCP ~49 bn on Casabourse. IAM is therefore the 2nd or 3rd largest stock depending on the session.
Zoom: volume and liquidity
44,070 shares traded per day is among the highest volumes on the Casablanca Stock Exchange. In practice: if you buy 50 IAM shares (~4,570 MAD), your order is less than 0.2 % of daily volume — it will fill without moving the price. Compare with Disway (~59 shares/day): there, 50 shares can represent almost an entire session. High volume reduces execution risk; it is a technical criterion on the page, not a buy recommendation on IAM.
Zoom: P/E and dividend
The P/E ~15–17x means the market pays 15 to 17 dirhams for each dirham of IAM’s annual earnings. That is reasonable for a mature telecom with moderate growth. The dividend yield ~4.4 % (DPS 1.43 MAD / price 91.4) makes it an income stock: you earn roughly 4.4 % per year in dividends, excluding price moves. Check in the RFA that earnings cover the dividend — at IAM, payout remains sustainable.
What the stock page does not tell you (and where to find it)
The stock page is a snapshot, not a full diagnosis. To go further on Casabourse:
- Income statement / balance sheet: annual accounts tab (revenue, EBITDA, net income)
- Dividend history: calendar and past amounts
- AMMC documents: RFA, earnings releases, issuer fact sheet
BVC practical case
Open the IAM page on Casabourse and copy the 8 fields from the table above with today’s data. Then open the comparator and compare IAM with BCP: market cap, P/E, dividend yield, volume. Which is more liquid? Which offers the best yield? The page alone does not answer — comparison does.
Key takeaways
- IAM: price ~91.4 MAD, market cap ~80.3 bn, volume ~44,070 — example of a highly liquid BVC page.
- Market cap = size; free float = shares actually tradable.
- P/E = first read on valuation; dividend yield = potential annual income.
- Volume > 5,000/day = comfortable for a beginner.
- The Casabourse stock page is the starting point; the comparator refines the choice.
Self-check
- What are IAM’s price and market cap on Casabourse?
- What does volume of 44,070 shares/day measure?
- How do you interpret a P/E of 15–17x?
- What is the difference between market cap and free float?
- Where do you find the income statement after the stock page?