
Le Ratio Dette/EBITDA : La Clé de la Solvabilité
الدين/EBITDA: الملاءة — LHM مقابل أسمنت المغرب
Debt/EBITDA: LHM vs Ciments du Maroc solvency
Traduction en cours — contenu affiché en français.
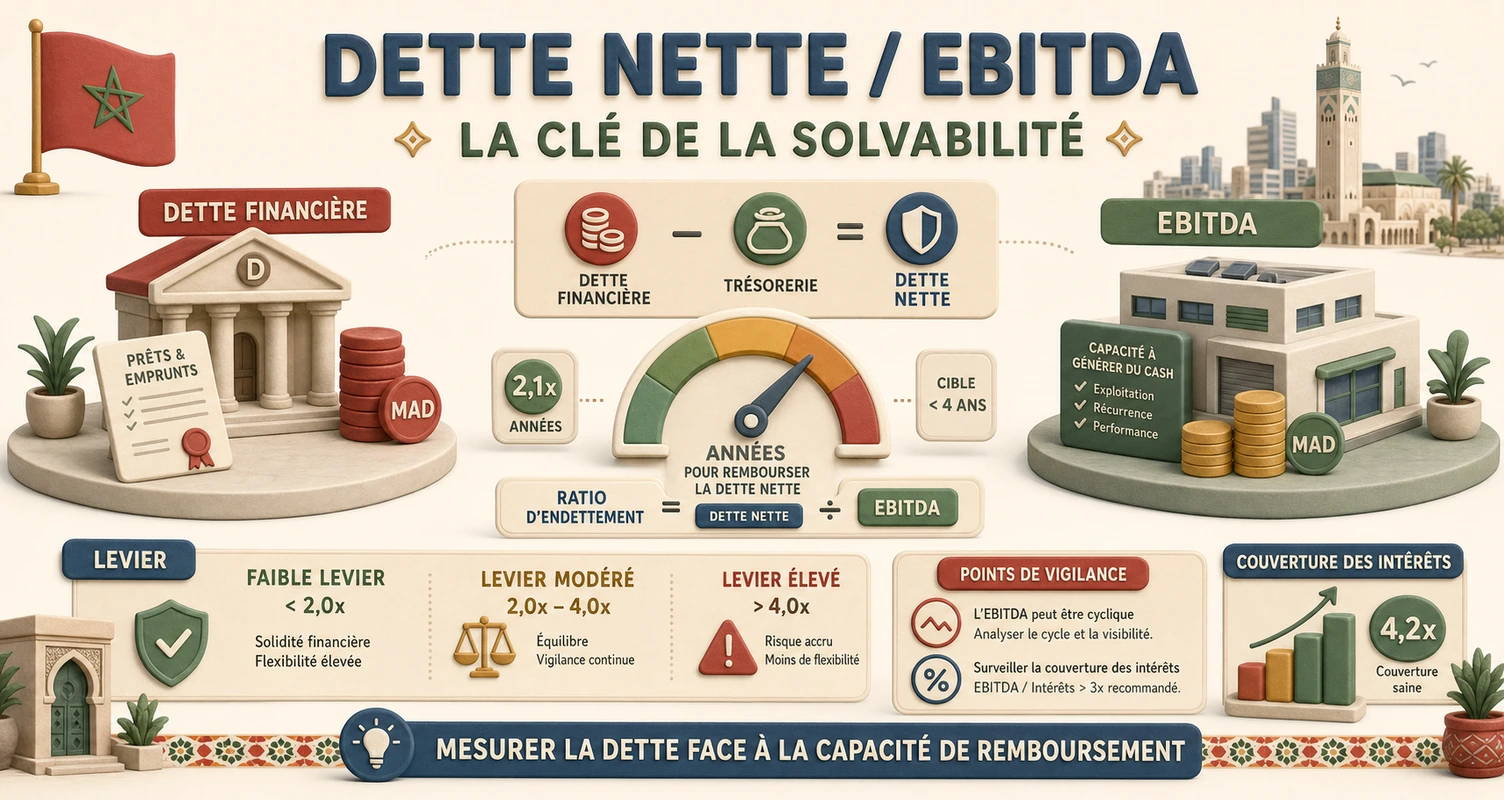
Cas pratique BVC – pourquoi ce ratio sur les cimentiers ?
Cas pratique BVC : avant d’acheter un titre du secteur materiaux, ouvrez le comparateur Casabourse avec LHM et CMA. Le ratio dette nette/EBITDA repond a une question simple : combien d’annees de rentabilite operationnelle brute faudrait-il pour rembourser la dette nette ? Sur un secteur capitalistique (fours, broyage, logistique), ce ratio est souvent plus parlant que le PER.
Regle empirique sur la cote marocaine : en dessous de 2x, le levier est generalement confortable ; entre 2x et 3x, vigilance ; au-dessus de 3x, le risque de refinancement ou de coupe de dividende monte. Une dette nette negative (tresorerie nette) signifie que l’entreprise detient plus de cash que de dette financiere – le ratio devient negatif ou non pertinent, mais c’est un signal positif.
Tableau dette/EBITDA 2024 – duel cimentiers
| Indicateur 2024 | LafargeHolcim Maroc (LHM) | Ciments du Maroc (CMA) | Lecture |
|---|---|---|---|
| Chiffre d’affaires | 8,16 Mds MAD | 4,36 Mds MAD | LHM ~1,9x la taille de CMA |
| EBITDA 2024 | ~3,65 Mds MAD | 1,78 Mds MAD | LHM : ligne EBITDA 2024 a recouper RFA ; proxy 2023 publie |
| Dette nette fin 2024 | 4,37 Mds MAD | −673 M MAD (tresorerie nette) | CMA en position de cash net |
| Dette nette / EBITDA | ~1,2x | < 0x (cash net) | LHM assume du levier ; CMA a une marge de manoeuvre |
| Dette brute 2024 | 4,53 Mds MAD | 187 M MAD | CMA quasi sans endettement brut |
| Resultat net 2024 | 1 826 M MAD | 935 M MAD | Les deux profitables malgre des profils de bilan differents |
| PER (cours / EPS 2024) | ~22,8x | ~24,6x | Valorisation comparable malgre le levier different |
| Dividende 2024 (DPS) | 70 MAD | 60 MAD | Payout LHM ~90 % ; CMA ~93 % |
Sources : RFA 2024 LHM et CMA, cours Casabourse (~1 779 MAD LHM, ~1 595 MAD CMA). EBITDA LHM 2024 estime sur base publiee 2023 (~3,65 Mds) – verifier la ligne exacte dans le RFA et le comparateur.
Lecture LHM – levier maitrise mais present
Avec 4,37 Mds de dette nette pour un EBITDA d’environ 3,65 Mds, LHM affiche un ratio ~1,2x. Ce n’est pas alarmant pour un leader national : les cash-flows historiques du groupe absorbent le service de la dette et le capex environnemental (substitution energetique, four a calcination). En revanche, en bas de cycle ciment ou si les taux restent eleves, ce levier pese sur la flexibilite : moins de marge pour augmenter le dividende ou racheter des titres qu’un pair sans dette.
Le marche le sait : LHM se traite avec une prime operationnelle (parts de marche, maillage logistique) mais son bilan est plus lourd que celui de CMA. Le ratio dette/EBITDA explique pourquoi deux cimentiers aux marges nettes proches (~22 % vs ~21 %) n’offrent pas le meme profil de risque.
Lecture CMA – tresorerie nette, ratio negatif
CMA affiche une dette nette negative de 673 M MAD en 2024 : la societe detient plus de liquidites et placements court terme que de dette financiere. Le ratio dette/EBITDA devient non pertinent en positif – on parle plutot de ” annees de tresorerie nette ” ou de capacite d’autofinancement disponible pour le capex sans emprunter.
Avec un EBITDA de 1,78 Mds et un RN de 935 M, CMA combine rentabilite et prudence de bilan. En periode de ralentissement des volumes (marche nord, concurrence prix), cette tresorerie nette est un coussin : pas de pression bancaire immediate, possibilite de maintenir le dividende (60 MAD, payout ~93 %) tant que les marges tiennent.
Trajectoire 2022-2024 – le ratio peut bouger sans que le cours suive
| Exercice | LHM dette nette | LHM EBITDA | LHM dette/EBITDA | CMA dette nette | CMA EBITDA |
|---|---|---|---|---|---|
| 2022 | 5,53 Mds | n/d | n/d | cash net | 1,65 Mds |
| 2023 | 4,99 Mds | 3,65 Mds | 1,37x | 588 M cash | 1,65 Mds |
| 2024 | 4,37 Mds | ~3,65 Mds | ~1,20x | 673 M cash | 1,78 Mds |
LHM ameliore legerement son ratio entre 2023 et 2024 (dette en baisse, EBITDA stable). CMA renforce sa tresorerie nette tout en faisant progresser l’EBITDA – le bilan s’ameliore des deux cotes, mais CMA reste nettement plus defensive sur le levier.
Verdict investisseur – quatre questions
- Le ratio est-il compare au bon secteur ? Dette/EBITDA sur cimentiers, pas sur banques (ou l’endettement est le metier).
- L’EBITDA est-il recurrent ? Retirer les plus-values ou reprises exceptionnelles avant de calculer.
- Quid du capex ? Un ratio bas avec un capex massif peut laisser peu de cash reel – croiser avec CAF ou FCF.
- Quel scenario macro ? En reprise BTP, LHM beneficie du levier ; en recession, CMA a plus de latitude.
Erreurs frequentes
- Utiliser dette/EBITDA sur une banque ou une assurance (ratios non comparables).
- Oublier le cash et les engagements hors bilan dans les groupes industriels.
- Conclure sur un seul trimestre sans lisser les effets saisonniers (ciment, distribution).
Choisissez la bonne réponse pour chaque question et consultez votre résultat à la fin.
La réponse attendue privilégie une décision structurée : faits, méthode, risque et cohérence avec le portefeuille.
La réponse attendue privilégie une décision structurée : faits, méthode, risque et cohérence avec le portefeuille.
La réponse attendue privilégie une décision structurée : faits, méthode, risque et cohérence avec le portefeuille.
La réponse attendue privilégie une décision structurée : faits, méthode, risque et cohérence avec le portefeuille.
La réponse attendue privilégie une décision structurée : faits, méthode, risque et cohérence avec le portefeuille.
حالة عملية BVC — لماذا هذه النسبة على شركات الإسمنت؟
حالة عملية BVC: قبل شراء سهم في قطاع المواد، افتح المُقارِن Casabourse مع LHM وCMA. نسبة الدين الصافي/EBITDA تجيب على سؤال بسيط: كم سنة من الربحية التشغيلية الإجمالية يلزم لسداد الدين الصافي؟ في قطاع رأسمالي (أفران، طحن، لوجستيك)، هذه النسبة غالباً أوضح من PER.
قاعدة تجريبية على البورصة المغربية: دون 2×، الرافعة مريحة عموماً؛ بين 2× و3×، يقظة؛ فوق 3×، يرتفع خطر إعادة التمويل أو خفض التوزيع. دين صافي سالب (خزينة صافية) يعني أن الشركة تمتلك نقداً أكثر من دينها المالي — النسبة تصبح سالبة أو غير ذات صلة، لكنها إشارة إيجابية.
جدول الدين/EBITDA 2024 — مواجهة شركات الإسمنت
| مؤشر 2024 | لافارج هولسيم المغرب (LHM) | أسمنت المغرب (CMA) | القراءة |
|---|---|---|---|
| رقم الأعمال | 8,16 مليار درهم | 4,36 مليار درهم | LHM ~1,9× حجم CMA |
| EBITDA 2024 | ~3,65 مليار درهم | 1,78 مليار درهم | LHM: سطر EBITDA 2024 للتدقيق في RFA؛ وكيل 2023 منشور |
| الدين الصافي نهاية 2024 | 4,37 مليار درهم | −673 مليون درهم (خزينة صافية) | CMA في وضع نقد صافي |
| الدين الصافي / EBITDA | ~1,2× | < 0× (نقد صافي) | LHM تتحمل رافعة؛ CMA لديها هامش مناورة |
| الدين الإجمالي 2024 | 4,53 مليار درهم | 187 مليون درهم | CMA شبه بلا دين إجمالي |
| النتيجة الصافية 2024 | 1,826 مليون درهم | 935 مليون درهم | كلاهما مربح رغم ملفات ميزانية مختلفة |
| مكرر الأرباح (PER) (السعر / EPS 2024) | ~22,8× | ~24,6× | تقييم متقارب رغم رافعة مختلفة |
| توزيع الأرباح 2024 (DPS) | 70 درهم | 60 درهم | نسبة توزيع LHM ~90%؛ وCMA ~93% |
المصادر: RFA 2024 LHM وCMA، أسعار Casabourse (~1,779 درهم LHM، ~1,595 درهم CMA). EBITDA LHM 2024 مقدّر على أساس 2023 المنشور (~3,65 مليار) — تحقق من السطر الدقيق في RFA والمُقارِن.
قراءة LHM — رافعة مضبوطة لكن موجودة
مع 4,37 مليار دين صافي لـ EBITDA نحو 3,65 مليار، LHM تعرض نسبة ~1,2×. ليست مقلقة لقائد وطني: التدفقات النقدية التاريخية للمجموعة تمتص خدمة الدين وcapex البيئي (استبدال طاقة، فرن التكلس). لكن في قاع دورة الإسمنت أو إذا بقيت الأسعار مرتفعة، هذه الرافعة تثقل المرونة: هامش أقل لرفع التوزيع أو إعادة شراء الأسهم مقارنة بنظير بلا دين.
السوق يعرف: LHM تُتداول بعلاوة تشغيلية (حصص السوق، شبكة لوجستية) لكن ميزانيتها أثقل من CMA. نسبة الدين/EBITDA تشرح لماذا شركتي إسمنت بهوامش صافية متقاربة (~22% مقابل ~21%) لا تقدمان نفس ملف المخاطر.
قراءة CMA — خزينة صافية، نسبة سالبة
CMA تعرض ديناً صافياً سالباً 673 مليون درهم في 2024: الشركة تمتلك سيولة واستثمارات قصيرة الأجل أكثر من دينها المالي. نسبة الدين/EBITDA تصبح غير ذات صلة بالموجب — نتحدث عن «سنوات الخزينة الصافية» أو قدرة التمويل الذاتي المتاحة لـ capex دون اقتراض.
مع EBITDA 1,78 مليار وRN 935 مليون، CMA تجمع الربحية وحذر الميزانية. في فترة تباطؤ الحجم (سوق الشمال، منافسة الأسعار)، هذه الخزينة الصافية وسادة: لا ضغط بنكي فوري، إمكانية الإبقاء على التوزيع (60 درهم، بنسبة توزيع ~93%) ما دامت الهوامش تصمد.
مسار 2022-2024 — النسبة قد تتحرك دون أن يتبعها السعر
| السنة المالية | دين صافي LHM | EBITDA LHM | دين/EBITDA LHM | دين صافي CMA | EBITDA CMA |
|---|---|---|---|---|---|
| 2022 | 5,53 مليار | غ/م | غ/م | نقد صافي | 1,65 مليار |
| 2023 | 4,99 مليار | 3,65 مليار | 1,37× | 588 مليون نقد | 1,65 مليار |
| 2024 | 4,37 مليار | ~3,65 مليار | ~1,20× | 673 مليون نقد | 1,78 مليار |
LHM تحسّن نسبتها قليلاً بين 2023 و2024 (دين في انخفاض، EBITDA مستقر). CMA تعزز خزينتها الصافية مع تقدم EBITDA — الميزانية تتحسن من الجانبين، لكن CMA تبقى أوضح دفاعياً على الرافعة.
حكم المستثمر — أربعة أسئلة
- هل تُقارن النسبة بالقطاع الصحيح؟ الدين/EBITDA على شركات الإسمنت، لا على البنوك (حيث الدين هو المهنة).
- هل EBITDA متكرر؟ أزل المكاسب الرأسمالية أو الاستثناءات قبل الحساب.
- ماذا عن capex؟ نسبة منخفضة مع capex ضخم قد تترك نقداً حقيقياً قليلاً — اقاطع مع CAF أو FCF.
- أي سيناريو اقتصادي كلي؟ في انتعاش البناء، LHM تستفيد من الرافعة؛ في ركود، CMA لديها مرونة أكبر.
اختر الإجابة الصحيحة لكل سؤال واطلع على نتيجتك في النهاية.
CMA امتلكت نحو 673 مليون درهم خزينة صافية نهاية 2024؛ LHM حملت ~4,37 مليار دين صافي.
4,37 مليار / ~3,65 مليار EBITDA ≈ 1,2 مرة.
خزينة صافية تجعل نسبة الدين/EBITDA غير ذات صلة بالموجب؛ إشارة ميزانية خفيفة.
فوق ~3×، يرتفع خطر إعادة التمويل والضغط على التوزيع في الشركات الصناعية.
المُقارِن يوازن الدين الصافي وEBITDA وPER والعائد على قاعدة موحدة.
BVC practical case — why this ratio for cement makers?
BVC practical case: before buying a materials-sector stock, open the Casabourse comparator with LHM and CMA. The net debt/EBITDA ratio answers a simple question: how many years of gross operating profit would it take to repay net debt? In a capital-intensive sector (kilns, grinding, logistics), this ratio is often more telling than P/E.
Empirical rule on the Moroccan market: below 2x, leverage is generally comfortable; between 2x and 3x, watch closely; above 3x, refinancing risk or dividend cuts rise. Negative net debt (net cash) means the company holds more cash than financial debt — the ratio turns negative or becomes irrelevant, but it is a positive signal.
Debt/EBITDA table 2024 — cement duel
| 2024 indicator | LafargeHolcim Maroc (LHM) | Ciments du Maroc (CMA) | Reading |
|---|---|---|---|
| Revenue | 8.16 bn MAD | 4.36 bn MAD | LHM ~1.9x CMA’s size |
| 2024 EBITDA | ~3.65 bn MAD | 1.78 bn MAD | LHM: 2024 EBITDA line to cross-check in RFA; 2023 published proxy |
| Net debt end-2024 | 4.37 bn MAD | −673 M MAD (net cash) | CMA in net cash position |
| Net debt / EBITDA | ~1.2x | < 0x (net cash) | LHM carries leverage; CMA has headroom |
| Gross debt 2024 | 4.53 bn MAD | 187 M MAD | CMA almost debt-free on a gross basis |
| 2024 net income | 1,826 M MAD | 935 M MAD | Both profitable despite different balance sheets |
| P/E (price / 2024 EPS) | ~22.8x | ~24.6x | Comparable valuation despite different leverage |
| 2024 dividend (DPS) | 70 MAD | 60 MAD | LHM payout ~90%; CMA ~93% |
Sources: LHM and CMA RFA 2024, Casabourse prices (~1,779 MAD LHM, ~1,595 MAD CMA). LHM 2024 EBITDA estimated from published 2023 base (~3.65 bn) — verify the exact line in the RFA and comparator.
Reading LHM — leverage present but under control
With 4.37 bn of net debt for EBITDA of about 3.65 bn, LHM shows a ratio of ~1.2x. That is not alarming for a national leader: the group’s historical cash flows absorb debt service and environmental capex (energy substitution, calcination kiln). However, in a cement downcycle or if rates stay high, this leverage weighs on flexibility: less room to raise the dividend or buy back shares than a debt-free peer.
The market knows this: LHM trades at an operational premium (market share, logistics network) but its balance sheet is heavier than CMA’s. The debt/EBITDA ratio explains why two cement makers with similar net margins (~22% vs ~21%) do not offer the same risk profile.
Reading CMA — net cash, negative ratio
CMA shows negative net debt of 673 M MAD in 2024: the company holds more liquid assets and short-term investments than financial debt. The debt/EBITDA ratio becomes not meaningful on a positive basis — we speak instead of “years of net cash” or self-financing capacity available for capex without borrowing.
With EBITDA of 1.78 bn and net income of 935 M, CMA combines profitability with balance-sheet prudence. In a period of slowing volumes (northern market, price competition), this net cash is a cushion: no immediate banking pressure, ability to maintain the dividend (60 MAD, payout ~93%) as long as margins hold.
2022–2024 trajectory — the ratio can move without the share price following
| Year | LHM net debt | LHM EBITDA | LHM debt/EBITDA | CMA net debt | CMA EBITDA |
|---|---|---|---|---|---|
| 2022 | 5.53 bn | n/d | n/d | net cash | 1.65 bn |
| 2023 | 4.99 bn | 3.65 bn | 1.37x | 588 M cash | 1.65 bn |
| 2024 | 4.37 bn | ~3.65 bn | ~1.20x | 673 M cash | 1.78 bn |
LHM slightly improves its ratio between 2023 and 2024 (debt down, EBITDA stable). CMA strengthens net cash while growing EBITDA — the balance sheet improves on both sides, but CMA remains clearly more defensive on leverage.
Investor verdict — four questions
- Is the ratio compared to the right sector? Debt/EBITDA for cement makers, not banks (where debt is the business).
- Is EBITDA recurring? Strip capital gains or exceptional reversals before calculating.
- What about capex? A low ratio with heavy capex may leave little real cash — cross-check with operating cash flow or FCF.
- What macro scenario? In a construction recovery, LHM benefits from leverage; in recession, CMA has more latitude.
Reproduce on Casabourse
Open LHM and CMA in the comparator. Note net debt and EBITDA over three years, calculate debt/EBITDA, then compare to P/E and dividend yield. The peer with the lowest ratio is not always the best deal if its growth or operational quality is inferior.
Key takeaways
- Net debt / EBITDA = years of gross margin to repay debt.
- LHM 2024: ~1.2x — leverage present but reasonable for a leader.
- CMA 2024: net cash ~673 M — negative ratio, defensive signal.
- Cross-check with capex, dividend and sector cycle before deciding.
- Always verify in the comparator and published RFAs.
Self-check
- Which cement maker shows net cash in 2024?
- What is LHM’s approximate debt/EBITDA ratio in 2024?
- Why is CMA’s ratio shown as < 0x?
- Above what threshold does debt/EBITDA call for heightened caution?
- Which Casabourse tool updates the LHM/CMA duel?
Ce contenu est fourni a des fins educatives. Il ne constitue pas un conseil en investissement personnalise ni une recommandation d acheter ou vendre une valeur. Verifiez toujours vos hypotheses, votre horizon et votre tolerance au risque.