
Le PER Avancé : TTM, Forward et Comparaison Sectorielle
مكرر الأرباح المتقدم: TTM، forward والمقارنة القطاعية
Advanced P/E: TTM, forward and sector comparison
Traduction en cours — contenu affiché en français.
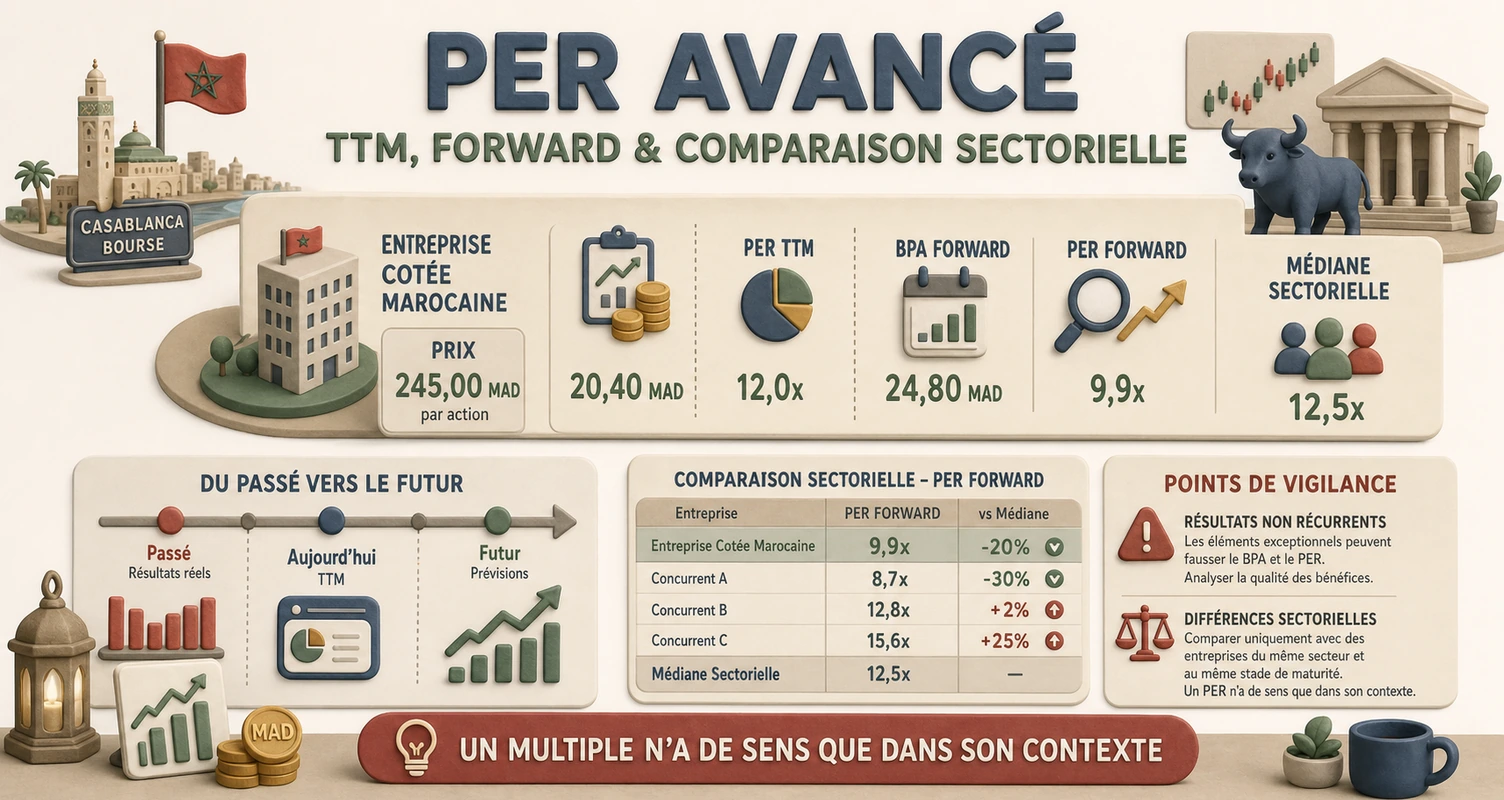
Le Price-Earnings Ratio (PER) est utile seulement quand il est relie a une societe reelle, a un benefice reel et a un secteur comparable. Sur la Bourse de Casablanca, le meme PER ne raconte pas la meme histoire pour une banque, un operateur telecom ou un cimentier.
Cas pratique Bourse de Casablanca
Les chiffres ci-dessous utilisent un snapshot Casabourse (juin 2026). Ils servent a apprendre la methode : avant une decision reelle, reprenez le dernier cours, le dernier resultat publie et les communiques financiers les plus recents sur les fiches ATW, BCP, IAM, LHM et CMA.
1. Le PER TTM avec une valeur reelle : Attijariwafa Bank
Le PER TTM regarde les benefices deja realises. Exemple avec Attijariwafa Bank (ATW) dans la base Casabourse :
| Donnee ATW | Snapshot | Lecture investisseur |
|---|---|---|
| Dernier cours | 680 MAD | Prix paye pour une action ATW a cette date |
| Capitalisation boursiere | 146,3 Mds MAD | Valeur totale que le marche donne aux capitaux propres |
| PER publie | 15,4x | Le marche paie 15,4 annees de benefices courants |
| Benefice net implicite | environ 9,5 Mds MAD | 146,3 / 15,4 = benefice utilise par le multiple |
La formule est simple : PER = Capitalisation boursiere / Resultat net. En sens inverse, le resultat net implicite est Capitalisation / PER. Pour ATW, 146,3 Mds MAD divises par 15,4 donnent environ 9,5 Mds MAD.
Pourquoi utiliser la capitalisation ?
Pour une banque, le PER doit etre calcule sur la valeur des fonds propres cotes, pas sur la valeur d’entreprise. La dette bancaire fait partie du metier, donc EV/EBITDA est moins pertinent qu’un PER, un P/B et un ROE.
2. TTM vs Forward : le meme ATW sous trois scenarios
Le PER forward remplace le benefice deja connu par un benefice estime. Il est donc plus utile pour anticiper, mais plus fragile parce qu’il depend d’une hypothese.
| Scenario ATW N+1 | Resultat net estime | PER forward estime | Ce que cela signifie |
|---|---|---|---|
| Prudent : benefice −10 % | environ 9,5 Mds MAD | 15,4x | L’action devient plus chere si les benefices baissent |
| Base : benefice stable | environ 9,5 Mds MAD | 15,4x | Le PER forward reste proche du PER TTM |
| Optimiste : benefice +10 % | environ 11,7 Mds MAD | 12,5x | Le titre parait moins cher si la croissance se realise |
La lecon pratique : un PER forward bas n’est pas une preuve. Il faut expliquer pourquoi le benefice va monter : croissance du PNB, cout du risque maitrise, meilleure efficacite operationnelle, ou effet non recurrent qui disparait.
3. Comparaison sectorielle : ATW vs BCP, puis hors secteur
Un PER ne se juge pas seul. Il doit d’abord etre compare a une societe du meme secteur, puis seulement ensuite au marche global.
| Valeur BVC | Secteur | Cours | Capitalisation | PER | Rendement dividende |
|---|---|---|---|---|---|
| ATW | Banque | 680 MAD | 146,3 Mds MAD | 15,4x | 3,24 % |
| BCP | Banque | 241 MAD | 49,0 Mds MAD | 12,0x | 4,36 % |
| IAM | Telecom | 91,4 MAD | 80,3 Mds MAD | 11,53x | 4,38 % |
| LHM | Ciment | 1 779 MAD | 41,7 Mds MAD | 19,24x | 5,40 % |
| CMA | Ciment | – | – | ~18-20x | ~5 % |
ATW se paie environ 28 % plus cher que BCP en PER (15,4 / 12,0 − 1). Ce premium peut etre acceptable si ATW affiche une meilleure qualite de resultat, une croissance plus visible, une rentabilite superieure ou un risque percu plus faible. Il n’est pas acceptable simplement parce que le nom est connu.
Erreur frequente
Dire que BCP est automatiquement moins chere qu’ATW parce que son PER est plus bas est incomplet. La vraie question est : le PER plus bas compense-t-il les differences de croissance, de risque, de liquidite, de cout du risque et de rendement ?
4. Ne comparez pas une banque avec un cimentier
LafargeHolcim Maroc (LHM) affiche ici un PER de 19,24x, superieur a ATW et BCP. Cela ne veut pas dire automatiquement que LHM est surevaluee. Un cimentier se lit avec d’autres variables : volumes de ciment, prix de vente, energie, marges, capex, cycle immobilier et politique de dividende. Pour une comparaison intra-secteur, ouvrez Ciments du Maroc (CMA) – les deux cimentiers BVC se comparent entre eux, pas avec ATW.
Maroc Telecom (IAM), avec un PER de 11,53x et un rendement de 4,38 %, doit aussi etre analysee autrement : stabilite du cash-flow, pression concurrentielle, investissements reseau, croissance Afrique, regulation et capacite a maintenir le dividende.
5. Mini-checklist avant d’utiliser le PER sur la cote marocaine
- Verifier le benefice utilise : resultat annuel, TTM, S1 annualise ou estimation analyste ?
- Nettoyer les elements exceptionnels : plus-value, provision ponctuelle, effet fiscal ou variation de perimetre.
- Comparer dans le meme secteur : ATW avec BCP ou BOA, pas avec un cimentier.
- Regarder le dividende : un PER moyen peut rester interessant si le rendement est durable.
- Tester un scenario forward : que devient le PER si le benefice baisse de 10 % ?
- Tenir compte de la liquidite : une petite capitalisation peut afficher un PER seduisant mais etre difficile a acheter ou vendre correctement.
6. Decision pratique
Le PER est un point de depart, pas une decision. Sur ATW, l’investisseur doit expliquer pourquoi payer 15,4x les benefices est raisonnable face a BCP a 12,0x. Sur IAM, il doit juger la stabilite du dividende. Sur LHM et CMA, il doit comprendre le cycle du ciment. Le bon reflexe est donc : PER + qualite du benefice + secteur + scenario + marge de securite.
Cas pratique BVC
Ouvrez le comparateur Casabourse et selectionnez ATW, BCP, LHM et CMA. Verifiez que vous comparez le meme exercice (2024), la meme devise (MAD) et des EPS retraites des exceptionnels. Calculez le benefice implicite d’ATW (capi / PER). Puis estimez le PER forward ATW si le resultat baisse de 10 %. Enfin, duel cimentiers : LHM vs CMA – lequel offre le PER le plus bas pour une qualite de marge comparable ? Ajoutez IAM comme ancre defensive : son PER est-il plus bas que ATW avec un rendement superieur ? Notez votre conclusion en 5 lignes – le PER seul ne suffit pas, mais la comparaison sectorielle structure votre decision.
Choisissez la bonne réponse pour chaque question et consultez votre résultat à la fin.
La réponse attendue privilégie une décision structurée : faits, méthode, risque et cohérence avec le portefeuille.
La réponse attendue privilégie une décision structurée : faits, méthode, risque et cohérence avec le portefeuille.
La réponse attendue privilégie une décision structurée : faits, méthode, risque et cohérence avec le portefeuille.
La réponse attendue privilégie une décision structurée : faits, méthode, risque et cohérence avec le portefeuille.
La réponse attendue privilégie une décision structurée : faits, méthode, risque et cohérence avec le portefeuille.
مكرر الأرباح (PER) مفيد فقط عندما يُربط بشركة حقيقية، وربح حقيقي، وقطاع قابل للمقارنة. على بورصة الدار البيضاء، نفس PER لا يحكي نفس القصة لبنك أو مشغّل اتصالات أو شركة إسمنت.
حالة عملية بورصة الدار البيضاء
الأرقام أدناه تستخدم لقطة Casabourse (يونيو 2026). تخدم تعلم المنهج: قبل قرار حقيقي، أعد آخر سعر وآخر نتيجة منشورة وأحدث البيانات المالية على بطاقات ATW وBCP وIAM وLHM وCMA.
1. PER TTM بقيمة حقيقية: التجاري وفا بنك
PER TTM ينظر للأرباح المحققة. مثال مع التجاري وفا بنك (ATW) في قاعدة Casabourse:
| بيان ATW | لقطة | قراءة المستثمر |
|---|---|---|
| آخر سعر | 680 درهم | السعر المدفوع لسهم ATW في هذا التاريخ |
| القيمة السوقية | 146,3 مليار درهم | القيمة الإجمالية التي يعطيها السوق لحقوق الملكية |
| PER المنشور | 13,8× | السوق يدفع 13,8 سنة من الأرباح الجارية |
| الربح الصافي الضمني | نحو 10,6 مليار درهم | 146,3 / 13,8 = الربح المستخدم بالمضاعف |
الصيغة بسيطة: PER = القيمة السوقية / النتيجة الصافية. بالعكس، الربح الصافي الضمني هو القيمة السوقية / PER. لـ ATW، 146,3 مليار درهم مقسومة على 13,8 تعطي نحو 10,6 مليار درهم.
لماذا استخدام القيمة السوقية؟
للبنك، PER يُحسب على قيمة حقوق الملكية المدرجة، لا قيمة المؤسسة. دين البنك جزء من المهنة، إذن EV/EBITDA أقل صلة من PER وP/B وROE.
2. TTM مقابل Forward: نفس ATW بثلاثة سيناريوهات
PER forward يستبدل الربح المعروف بربح مقدّر. إذن أكثر فائدة للتوقع، لكن أكثر هشاشة لأنه يعتمد على فرضية.
| سيناريو ATW N+1 | النتيجة الصافية المقدّرة | PER forward المقدّر | ماذا يعني |
|---|---|---|---|
| حذر: ربح −10% | نحو 9,5 مليار درهم | 15,4× | السهم يصبح أغلى إذا انخفضت الأرباح |
| أساس: ربح مستقر | نحو 10,6 مليار درهم | 13,8× | PER forward يبقى قريباً من PER TTM |
| متفائل: ربح +10% | نحو 11,7 مليار درهم | 12,5× | السهم يبدو أرخص إذا تحقق النمو |
الدرس العملي: PER forward منخفض ليس دليلاً. يجب تفسير لماذا سيرتفع الربح: نمو PNB، تكلفة مخاطر مضبوطة، كفاءة تشغيلية أفضل، أو أثر غير متكرر يختفي.
3. مقارنة قطاعية: ATW مقابل BCP، ثم خارج القطاع
PER لا يُحكم عليه وحده. يُقارن أولاً بشركة من نفس القطاع، ثم فقط بالسوق العام.
| قيمة BVC | القطاع | السعر | القيمة السوقية | PER | عائد التوزيع |
|---|---|---|---|---|---|
| ATW | بنك | 680 درهم | 146,3 مليار درهم | 13,8× | 3,24% |
| BCP | بنك | 241 درهم | 49,0 مليار درهم | 10,89× | 4,36% |
| IAM | اتصالات | 91,4 درهم | 80,3 مليار درهم | 11,53× | 4,38% |
| LHM | إسمنت | 1,779 درهم | 41,7 مليار درهم | 19,24× | 5,40% |
| CMA | إسمنت | – | – | ~18-20× | ~5% |
تُدفع ATW أغلى بنحو 27% من BCP في PER (13,8 / 10,89 − 1). وهذه العلاوة مقبولة إذا كانت ATW تعرض جودة نتائج أفضل، أو نمواً أوضح، أو ربحية أعلى، أو مخاطر مُدرَكة أقل. أما لمجرد أن الاسم معروف، فلا.
خطأ شائع
قول إن BCP أرخص تلقائياً من ATW لأن PER أدنى غير كافٍ. السؤال الحقيقي: هل PER الأدنى يعوّض فروق النمو والمخاطر والسيولة وتكلفة المخاطر والعائد؟
4. لا تقارن بنكاً بشركة إسمنت
لافارج هولسيم المغرب (LHM) تعرض هنا PER 19,24×، أعلى من ATW وBCP. هذا لا يعني تلقائياً أن LHM مُقيّمة بأعلى من قيمتها. شركة إسمنت تُقرأ بمتغيرات أخرى: أحجام الإسمنت، أسعار البيع، الطاقة، الهوامش، capex، دورة العقار وسياسة التوزيع. للمقارنة داخل القطاع، افتح أسمنت المغرب (CMA) — شركتا الإسمنت BVC تُقارنان ببعضهما، لا مع ATW.
اتصالات المغرب (IAM)، بـ PER 11,53× وعائد 4,38%، تُحلَّل أيضاً بشكل مختلف: استقرار التدفق النقدي، ضغط المنافسة، استثمارات الشبكة، نمو أفريقيا، التنظيم وقدرة الإبقاء على التوزيع.
5. قائمة تحقق مصغّرة قبل استخدام PER على البورصة المغربية
- تحقق من الربح المستخدم: نتيجة سنوية، TTM، S1 سنوي أو تقدير محلل؟
- نظّف البنود الاستثنائية: مكاسب رأسمالية، مخصص لحظي، أثر ضريبي أو تغيير نطاق.
- قارن داخل نفس القطاع: ATW مع BCP أو BOA، لا مع شركة إسمنت.
- انظر للتوزيع: PER متوسط قد يبقى جذاباً إذا العائد مستدام.
- اختبر سيناريو forward: ماذا يصبح PER إذا انخفض الربح 10%؟
- احسب السيولة: قيمة سوقية صغيرة قد تعرض PER جذاباً لكن يصعب الشراء أو البيع بشكل صحيح.
6. قرار عملي
PER نقطة بداية، لا قرار. على ATW، يجب على المستثمر تفسير لماذا دفع 13,8× الأرباح معقول أمام BCP عند 10,89×. على IAM، يحكم استقرار التوزيع. على LHM وCMA، يفهم دورة الإسمنت. الانعكاس الصحيح: PER + جودة الربح + القطاع + السيناريو + هامش أمان.
حالة عملية BVC
افتح المُقارِن Casabourse واختر ATW وBCP وLHM وCMA. تحقق أنك تقارن نفس السنة (2024)، نفس العملة (درهم) وEPS مُنقّى من الاستثناءات. احسب الربح الضمني لـ ATW (القيمة السوقية / PER). ثم قدّر PER forward لـ ATW إذا انخفضت النتيجة 10%. أخيراً، مواجهة الإسمنت: LHM مقابل CMA — أيهما يقدم PER أدنى لجودة هامش متقاربة؟ أضف IAM كركيزة دفاعية: هل PER أدنى من ATW مع عائد أعلى؟ سجّل استنتاجك في 5 أسطر — PER وحده لا يكفي، لكن المقارنة القطاعية تهيكل قرارك.
اختر الإجابة الصحيحة لكل سؤال واطلع على نتيجتك في النهاية.
الربح الضمني = القيمة السوقية / PER = 146,3 / 13,8 ≈ 10,6 مليار درهم.
PER forward يستبدل الربح المحقق بتقدير — هش إذا لم يتحقق النمو.
PER البنك يُقارن بنظراء بنكيين — لا بشركات إسمنت أو اتصالات.
مقارنة داخل القطاع: شركتا الإسمنت BVC تُحكمان متبادلة، لا مقابل بنك.
المُقارِن يحدّث PER والعائد على قاعدة موحدة — تحقق من السنة وEPS المنقّى.
The price-earnings ratio (P/E) is useful only when tied to a real company, real earnings and a comparable sector. On the Casablanca Stock Exchange, the same P/E tells a different story for a bank, a telecom operator or a cement producer.
BVC practical case
The figures below use a Casabourse snapshot (June 2026). They illustrate the method: before any real decision, update the latest price, the latest published results and the most recent financial releases on the ATW, BCP, IAM, LHM and CMA company pages.
1. TTM P/E with a real stock: Attijariwafa Bank
TTM P/E looks at earnings already delivered. Example with Attijariwafa Bank (ATW) in the Casabourse database:
| ATW data | Snapshot | Investor read |
|---|---|---|
| Latest price | 680 MAD | Price paid for one ATW share on that date |
| Market capitalisation | 146.3 bn MAD | Total value the market assigns to equity |
| Published P/E | 13.8x | The market pays 13.8 years of current earnings |
| Implied net income | around 10.6 bn MAD | 146.3 / 13.8 = earnings used by the multiple |
The formula is simple: P/E = Market capitalisation / Net income. In reverse, implied net income is Capitalisation / P/E. For ATW, 146.3 bn MAD divided by 13.8 gives roughly 10.6 bn MAD.
Why use market capitalisation?
For a bank, P/E should be calculated on the value of listed equity, not enterprise value. Bank debt is part of the business, so EV/EBITDA is less relevant than P/E, P/B and ROE.
2. TTM vs forward: the same ATW under three scenarios
Forward P/E replaces known earnings with estimated earnings. It is more useful for anticipating the future, but more fragile because it depends on an assumption.
| ATW N+1 scenario | Estimated net income | Estimated forward P/E | What it means |
|---|---|---|---|
| Prudent: earnings −10 % | around 9.5 bn MAD | 15.4x | The stock looks more expensive if earnings fall |
| Base: stable earnings | around 10.6 bn MAD | 13.8x | Forward P/E stays close to TTM P/E |
| Optimistic: earnings +10 % | around 11.7 bn MAD | 12.5x | The stock looks cheaper if growth materialises |
The practical lesson: a low forward P/E is not proof. You must explain why earnings will rise: NII growth, controlled cost of risk, better operating efficiency, or a non-recurring item that disappears.
3. Sector comparison: ATW vs BCP, then outside the sector
A P/E should not be judged in isolation. Compare it first to a company in the same sector, and only then to the market as a whole.
| BVC stock | Sector | Price | Market cap | P/E | Dividend yield |
|---|---|---|---|---|---|
| ATW | Bank | 680 MAD | 146.3 bn MAD | 13.8x | 3.24 % |
| BCP | Bank | 241 MAD | 49.0 bn MAD | 10.89x | 4.36 % |
| IAM | Telecom | 91.4 MAD | 80.3 bn MAD | 11.53x | 4.38 % |
| LHM | Cement | 1,779 MAD | 41.7 bn MAD | 19.24x | 5.40 % |
| CMA | Cement | – | – | ~18–20x | ~5 % |
ATW trades at roughly 27 % more than BCP on P/E (13.8 / 10.89 − 1). That premium can be acceptable if ATW shows better earnings quality, more visible growth, higher profitability or lower perceived risk. It is not acceptable simply because the name is well known.
Common mistake
Saying BCP is automatically cheaper than ATW because its P/E is lower is incomplete. The real question is: does the lower P/E compensate for differences in growth, risk, liquidity, cost of risk and yield?
4. Do not compare a bank with a cement producer
LafargeHolcim Maroc (LHM) shows a P/E of 19.24x here, above ATW and BCP. That does not automatically mean LHM is overvalued. A cement producer is read through other variables: cement volumes, selling prices, energy, margins, capex, the property cycle and dividend policy. For an intra-sector comparison, open Ciments du Maroc (CMA) — the two BVC cement producers compare with each other, not with ATW.
Maroc Telecom (IAM), with a P/E of 11.53x and a yield of 4.38 %, must also be analysed differently: cash-flow stability, competitive pressure, network investment, Africa growth, regulation and ability to maintain the dividend.
5. Mini-checklist before using P/E on Moroccan stocks
- Check the earnings used: annual result, TTM, annualised H1 or analyst estimate?
- Strip exceptional items: capital gains, one-off provisions, tax effects or scope changes.
- Compare within the same sector: ATW with BCP or BOA, not with a cement producer.
- Look at the dividend: a middling P/E can still be attractive if the yield is sustainable.
- Test a forward scenario: what happens to P/E if earnings fall 10 %?
- Factor in liquidity: a small market cap can show an attractive P/E but be hard to buy or sell efficiently.
6. Practical decision
P/E is a starting point, not a decision. On ATW, the investor must explain why paying 13.8x earnings is reasonable versus BCP at 10.89x. On IAM, they must judge dividend stability. On LHM and CMA, they must understand the cement cycle. The right reflex is therefore: P/E + earnings quality + sector + scenario + margin of safety.
BVC practical case
Open the Casabourse comparator and select ATW, BCP, LHM and CMA. Confirm you are comparing the same fiscal year (2024), the same currency (MAD) and EPS adjusted for exceptional items. Calculate ATW’s implied earnings (market cap / P/E). Then estimate ATW forward P/E if earnings fall 10 %. Finally, cement duel: LHM vs CMA — which offers the lower P/E for comparable margin quality? Add IAM as a defensive anchor: is its P/E lower than ATW’s with a higher yield? Write your conclusion in five lines — P/E alone is not enough, but sector comparison structures your decision.
Self-check
- Calculate ATW’s implied earnings using market cap and P/E.
- Identify the main risk of forward P/E.
- Choose the right sector comparison for ATW.
- Why compare LHM with CMA and not with ATW?
- How do you validate your P/E ratios in the Casabourse comparator?
Ce contenu est fourni a des fins educatives. Il ne constitue pas un conseil en investissement personnalise ni une recommandation d acheter ou vendre une valeur. Verifiez toujours vos hypotheses, votre horizon et votre tolerance au risque.