Les indices MASI, MSI 20 et MASI ESG : que mesurent-ils ?
مؤشرات MASI وMSI 20 وMASI ESG: ماذا تقيس؟
MASI, MSI 20 and MASI ESG indices: what do they measure?
Traduction en cours — contenu affiché en français.
Qu’est-ce qu’un indice boursier ?
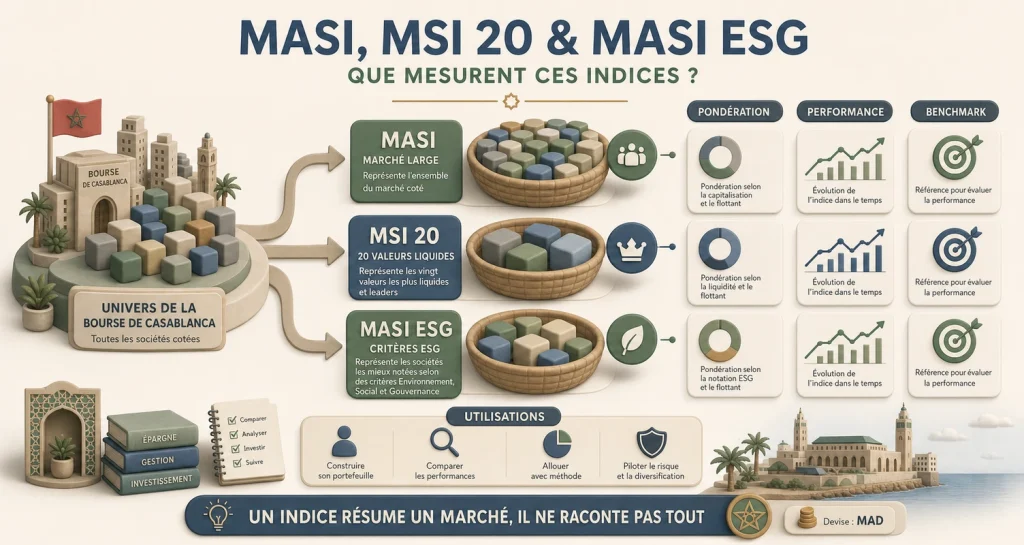
Un indice est un panier de valeurs dont on suit l’evolution moyenne, ponderee par la taille de chaque composant. Il traduit en un seul chiffre la tendance d’un marche ou d’un secteur. Quand le MASI monte de 1 %, l’ensemble des valeurs cotees progresse en moyenne – mais pas toutes egalement : les grosses capitalisations tirent l’indice plus que les petites.
Le MASI : barometre de toute la cote
Le MASI (Moroccan All Shares Index) regroupe l’ensemble des valeurs cotees a la Bourse de Casablanca. Il est calcule en capitalisation flottante : seule la part des actions reellement disponibles a l’echange (le flottant) compte dans la ponderation. Un actionnaire de controle qui detient 60 % du capital ne fait pas bouger l’indice avec ses ventes – c’est le flottant qui pese.
Qui pese dans le MASI ? – Top composants
Trois valeurs concentrent une part majeure du MASI. Voici leurs caracteristiques sur Casabourse (juin 2026) :
| Rang | Valeur | Capitalisation (~) | Poids indicatif MASI | Volume/jour (~) | Impact sur l’indice |
|---|---|---|---|---|---|
| 1 | Attijariwafa Bank (ATW) | ~146 Mds MAD | ~18-20 % | ~48 104 | 1re capitalisation : une hausse de 2 % chez ATW peut a elle seule ajouter ~0,35 pt au MASI |
| 2 | Maroc Telecom (IAM) | ~80 Mds MAD | ~12-14 % | ~44 070 | Valeur defensive : stabilise le MASI en periode de stress, mais freine aussi les rallies |
| 3 | BCP | ~49 Mds MAD | ~7-9 % | ~8 130 | 2e banque du Maroc : correlee au secteur bancaire et au cycle du credit |
| Top 3 combine | ~275 Mds MAD | ~38-43 % | – | Pres de la moitie du MASI depend de 3 titres seulement | |
Poids indicatifs bases sur capitalisation flottante (Casabourse, juin 2026). Les ponderations exactes sont recalculees periodiquement par la BVC.
Concept : la ponderation par capitalisation flottante
Imaginez le MASI comme une balance : plus une societe est grosse et liquide (flottant eleve), plus elle pese lourd. Formule simplifiee :
Poids = (Cours × Nombre d’actions flottantes) / Total capitalisation flottante de la cote
Consequences pour vous :
- Si vous detenez uniquement ATW, IAM et BCP, votre portefeuille ressemble au MASI – vous ne diversifiez pas vraiment.
- Une micro-cap qui double ne fait presque pas bouger le MASI.
- Le MASI peut monter alors que votre valeur preferee baisse (et inversement).
Le MSI 20 : les 20 locomotives
Le MSI 20 reunit les 20 valeurs les plus importantes et les plus liquides. ATW, IAM et BCP y figurent naturellement, avec Label Vie, LafargeHolcim, Cosumar, etc. Plus concentre que le MASI, il reflete le comportement des ” poids lourds ” que les investisseurs echangent le plus facilement.
Indices sectoriels et MASI ESG
La BVC publie aussi des indices sectoriels (banques, telecoms, immobilier…) et le MASI ESG (societes les mieux notees environnement, social, gouvernance). Comparer la performance d’ATW a l’indice bancaire, ou d’IAM a l’indice telecoms, est un reflexe d’analyse utile – disponible sur Casabourse.
A quoi servent les indices pour un debutant ?
- Barometre : le MASI monte ou baisse ? Vous situez le contexte general avant d’acheter.
- Benchmark : votre portefeuille fait-il mieux ou moins bien que le MASI sur 6 mois ?
- Diversification : si vous ne detenez que les 3 plus grosses capitalisations, vous n’etes pas diversifie malgre 3 valeurs differentes.
Zoom performance – MASI vs 4 composants (52 semaines)
Comprendre le MASI, c’est aussi voir qui tire l’indice sur un an. Variations indicatives Casabourse (juin 2025 → juin 2026) :
| Indice / valeur | Variation ~52 sem. | Poids MASI (indic.) | Lecture |
|---|---|---|---|
| MASI | +12,4 % | 100 % | Barometre global de la cote |
| ATW | +47,2 % | ~18-20 % | A surperforme l’indice – a tire le MASI vers le haut |
| IAM | −8,1 % | ~12-14 % | Sous-performe – frein defensif sur l’indice |
| BCP | +22,6 % | ~7-9 % | Contribue positivement, moins qu’ATW |
| Disway | +5,3 % | < 0,5 % | Micro-poids : votre gain n’a quasi aucun effet sur le MASI |
Chiffres indicatifs Casabourse. Un portefeuille 100 % ATW aurait largement bat le MASI ; un portefeuille 100 % IAM aurait sous-performe malgre ” etre sur la cote “.
Cas pratique BVC
Ouvrez le comparateur Casabourse et comparez ATW, IAM et BCP : capitalisation, variation 52 semaines, rendement dividende. Calculez mentalement : si ATW represente ~20 % du MASI et monte de 3 %, quel impact approximatif sur l’indice ? Puis ajoutez une 4e valeur hors top 3 (ex. Disway) et observez la difference de poids – c’est la diversification reelle.
Choisissez la bonne réponse pour chaque question et consultez votre résultat à la fin.
La réponse attendue privilégie une décision structurée : faits, méthode, risque et cohérence avec le portefeuille.
La réponse attendue privilégie une décision structurée : faits, méthode, risque et cohérence avec le portefeuille.
La réponse attendue privilégie une décision structurée : faits, méthode, risque et cohérence avec le portefeuille.
La réponse attendue privilégie une décision structurée : faits, méthode, risque et cohérence avec le portefeuille.
La réponse attendue privilégie une décision structurée : faits, méthode, risque et cohérence avec le portefeuille.
ما هو المؤشر البورصي؟
المؤشر سلة من القيم نتابع متوسط تطوّرها مُرجَّحاً بحجم كل مكوّن، فيترجم في رقم واحد اتجاه السوق أو القطاع. فعندما يرتفع MASI بنسبة 1%، تتقدّم القيم المُدرَجة في المتوسط — لكن لا بالتساوي: إذ تسحب القيمُ الكبرى المؤشرَ أكثر من الصغيرة.
MASI: مقياس السوق بأكمله
يجمع MASI (Moroccan All Shares Index) كل القيم المُدرَجة في بورصة الدار البيضاء، ويُحسب على أساس القيمة السوقية للأسهم الحرة (flottant): فلا يدخل في الترجيح إلا الجزء المتاح فعلياً للتداول. ومن ثَمّ فإن مساهماً مسيطراً يملك 60% من رأس المال لا يحرّك المؤشر بمبيعاته — لأن ما يثقل هو الأسهم الحرة.
من يثقل في MASI؟ — أبرز المكوّنات
تتركّز حصة كبيرة من MASI في ثلاث قيم. وهذه خصائصها على Casabourse (يونيو 2026):
| الترتيب | القيمة | القيمة السوقية (~) | وزن MASI الإرشادي | الحجم/يوم (~) | الأثر على المؤشر |
|---|---|---|---|---|---|
| 1 | التجاري وفا بنك (ATW) | ~146 مليار درهم | ~18–20% | ~48,104 | أكبر قيمة سوقية: ارتفاعٌ بنسبة 2% في ATW قد يضيف وحده ~0,35 نقطة إلى MASI |
| 2 | اتصالات المغرب (IAM) | ~80 مليار درهم | ~12–14% | ~44,070 | قيمة دفاعية: تُثبّت MASI في فترات الضغط، لكنها تُبطئ موجات الصعود أيضاً |
| 3 | البنك الشعبي (BCP) | ~49 مليار درهم | ~7–9% | ~8,130 | ثاني بنك في المغرب: مرتبط بالقطاع البنكي وبدورة الائتمان |
| أكبر 3 مجتمعة | ~275 مليار درهم | ~38–43% | – | نحو نصف MASI يتوقّف على 3 أسهم فقط | |
أوزان إرشادية مبنية على القيمة السوقية للأسهم الحرة (Casabourse، يونيو 2026). أما الأوزان الدقيقة فتُعيد BVC حسابها دورياً.
المفهوم: الترجيح بالقيمة السوقية للأسهم الحرة
تخيّل MASI ميزاناً: فكلما كانت الشركة أكبر و أسهمها الحرة أعلى سيولة، زاد وزنها فيه. وإليك الصيغة المبسّطة:
الوزن = (السعر × عدد الأسهم الحرة) / إجمالي القيمة السوقية للأسهم الحرة في السوق
وما يعنيه ذلك لك:
- إذا امتلكت ATW وIAM وBCP فقط، فإن محفظتك تشبه MASI — أي أنك لا تنوّع حقاً.
- قيمة صغيرة (micro-cap) تتضاعف لا تكاد تحرّك MASI.
- قد يرتفع MASI بينما تنخفض قيمتك المفضّلة، والعكس صحيح.
MSI 20: القاطرات العشرون
يجمع MSI 20 أهمّ 20 قيمة وأكثرها سيولة. وتندرج فيه ATW وIAM وBCP بطبيعة الحال، إلى جانب Label Vie ولافارج هولسيم وكوسومار وغيرها. وهو أكثر تركيزاً من MASI، إذ يعكس سلوك «الأوزان الثقيلة» التي يتداولها المستثمرون بأكبر سهولة.
المؤشرات القطاعية وMASI ESG
تنشر BVC أيضاً مؤشرات قطاعية (بنوك، اتصالات، عقار…) وMASI ESG (الشركات الأعلى تقييماً بيئياً واجتماعياً وفي الحوكمة). ومقارنة أداء ATW بالمؤشر البنكي، أو IAM بمؤشر الاتصالات، عادة تحليلية مفيدة — وهي متاحة على Casabourse.
ما فائدة المؤشرات بالنسبة للمبتدئ؟
- مقياس عام: هل يرتفع MASI أم ينخفض؟ بذلك تحدّد السياق العام قبل الشراء.
- معيار مرجعي (benchmark): هل حقّقت محفظتك أداءً أفضل أم أضعف من MASI خلال 6 أشهر؟
- التنويع: إذا امتلكت أكبر 3 قيم سوقية فقط، فأنت غير مُنوِّع فعلياً رغم امتلاكك ثلاث قيم مختلفة.
إضاءة على الأداء — MASI مقابل 4 مكوّنات (52 أسبوعاً)
وفهم MASI يعني أيضاً معرفة مَن يسحب المؤشر على مدى سنة. وهذه تغيّرات إرشادية من Casabourse (يونيو 2025 → يونيو 2026):
| المؤشر / القيمة | التغير ~52 أسبوعاً | وزن MASI (إرشادي) | القراءة |
|---|---|---|---|
| MASI | +12,4% | 100% | مقياس عام للسوق |
| ATW | +47,2% | ~18–20% | تفوّق على المؤشر — وسحب MASI صعوداً |
| IAM | −8,1% | ~12–14% | أداء دون المؤشر — مكبح دفاعي عليه |
| BCP | +22,6% | ~7–9% | مساهمة إيجابية، لكنها أقل من ATW |
| Disway | +5,3% | < 0,5% | وزن ضئيل: ربحك لا يكاد يؤثّر على MASI |
أرقام إرشادية من Casabourse. كانت محفظة 100% ATW لتتفوّق بكثير على MASI، بينما كانت محفظة 100% IAM لتحقّق أداءً دون المؤشر رغم «وجودها في السوق».
حالة عملية في BVC
افتح مُقارِن Casabourse وقارِن بين ATW وIAM وBCP من حيث القيمة السوقية والتغير على 52 أسبوعاً وعائد التوزيع. واحسب ذهنياً: إذا كان ATW يمثّل ~20% من MASI وارتفع بنسبة 3%، فما الأثر التقريبي على المؤشر؟ ثم أضِف قيمة رابعة من خارج أكبر 3 (مثلاً Disway) ولاحِظ فرق الوزن — فهذا هو التنويع الحقيقي.
اختر الإجابة الصحيحة لكل سؤال واطلع على نتيجتك في النهاية.
يغطي MASI السوق بأكمله، والترجيح يعكس حجم الأسهم الحرة: فالقيم الكبرى تثقل أكثر.
التجاري وفا بنك (~146 مليار)، واتصالات المغرب (~80 مليار)، وBCP (~49 مليار) يهيمنون على القيمة السوقية للأسهم الحرة في السوق.
أسهم المساهمين المسيطرين لا تُتداول بحرية، والأسهم الحرة هي التي تقيس الجزء المتاح للسوق.
MSI 20 أكثر تركيزاً من MASI، إذ يعكس القيم الثقيلة الأكثر تداولاً.
إذا تقدّمت محفظتك بنسبة 5% بينما تقدّم MASI بنسبة 8%، فأنت دون أداء السوق.
What is a stock index?
An index is a basket of stocks whose average performance is tracked, weighted by each component’s size. It expresses a market or sector trend in a single number. When the MASI rises 1%, listed stocks advance on average — but not equally: large caps pull the index more than small ones.
The MASI: barometer of the whole market
The MASI (Moroccan All Shares Index) includes all stocks listed on the Casablanca Stock Exchange. It is calculated on a free-float market-cap basis: only the portion of shares actually available to trade (the float) counts in the weighting. A controlling shareholder holding 60% of capital does not move the index with their sales — the float does.
Who moves the MASI? — Top components
Three stocks concentrate a major share of the MASI. Here are their characteristics on Casabourse (June 2026):
| Rank | Stock | Market cap (~) | Indicative MASI weight | Volume/day (~) | Index impact |
|---|---|---|---|---|---|
| 1 | Attijariwafa Bank (ATW) | ~146 bn MAD | ~18–20% | ~48,104 | Largest cap: a 2% rise in ATW alone can add ~0.35 pt to the MASI |
| 2 | Maroc Telecom (IAM) | ~80 bn MAD | ~12–14% | ~44,070 | Defensive name: stabilises the MASI in stress, but also dampens rallies |
| 3 | BCP | ~49 bn MAD | ~7–9% | ~8,130 | Morocco’s 2nd bank: correlated to banking and the credit cycle |
| Top 3 combined | ~275 bn MAD | ~38–43% | – | Nearly half the MASI depends on 3 stocks alone | |
Indicative weights based on free-float market cap (Casabourse, June 2026). Exact weights are recalculated periodically by the BVC.
Concept: free-float market-cap weighting
Think of the MASI as a scale: the bigger and more liquid a company is (high float), the heavier it weighs. Simplified formula:
Weight = (Price × Free-float shares) / Total free-float market cap of the market
Consequences for you:
- If you hold only ATW, IAM and BCP, your portfolio mirrors the MASI — you are not truly diversified.
- A micro-cap that doubles barely moves the MASI.
- The MASI can rise while your favourite stock falls (and vice versa).
The MSI 20: the 20 locomotives
The MSI 20 groups the 20 largest and most liquid names. ATW, IAM and BCP naturally feature, along with Label Vie, LafargeHolcim, Cosumar, etc. More concentrated than the MASI, it reflects the behaviour of the “heavyweights” investors trade most easily.
Sector indices and MASI ESG
The BVC also publishes sector indices (banks, telecoms, real estate…) and the MASI ESG (companies best rated on environment, social and governance). Comparing ATW performance to the bank index, or IAM to telecoms, is a useful analysis habit — available on Casabourse.
What are indices for as a beginner?
- Barometer: is the MASI up or down? You situate the general context before buying.
- Benchmark: is your portfolio doing better or worse than the MASI over 6 months?
- Diversification: if you hold only the 3 largest caps, you are not diversified despite 3 different names.
Performance zoom — MASI vs 4 components (52 weeks)
Understanding the MASI also means seeing who pulls the index over a year. Indicative Casabourse variations (June 2025 → June 2026):
| Index / stock | ~52-week change | Indic. MASI weight | Reading |
|---|---|---|---|
| MASI | +12.4% | 100% | Overall market barometer |
| ATW | +47.2% | ~18–20% | Outperformed the index — pulled the MASI up |
| IAM | −8.1% | ~12–14% | Underperformed — defensive drag on the index |
| BCP | +22.6% | ~7–9% | Positive contribution, less than ATW |
| Disway | +5.3% | < 0.5% | Micro weight: your gain barely affects the MASI |
Indicative Casabourse figures. A 100% ATW portfolio would have beaten the MASI by a wide margin; a 100% IAM portfolio would have underperformed despite “being in the market”.
Practical exercise on the BVC
Open the Casabourse comparator and compare ATW, IAM and BCP: market cap, 52-week change, dividend yield. Estimate mentally: if ATW is ~20% of the MASI and rises 3%, what approximate impact on the index? Then add a 4th name outside the top 3 (e.g. Disway) and observe the weight difference — that is real diversification.
Key takeaways
- The MASI covers the whole market, weighted by free-float market cap.
- ATW (~20%), IAM (~13%), BCP (~8%): the top 3 weighs ~40% of the index.
- The MSI 20 is more concentrated on large liquid names.
- Comparing your portfolio to the MASI = knowing if you beat the market.
- Casabourse and the comparator let you visualise market caps and relative weights.
Self-check
- What does the MASI include and how is it weighted?
- What are the three largest MASI weights on Casabourse?
- Why does the float matter in index calculation?
- How does the MSI 20 differ from the MASI?
- How do you use the MASI as a benchmark for your portfolio?