
Maîtriser la Performance Financière : EBIT, EBITDA et Résultat d’Exploitation
EBIT وEBITDA وتسلسل النقد: حالة اتصالات المغرب
EBIT, EBITDA and the cash cascade: the Maroc Telecom case
Traduction en cours — contenu affiché en français.
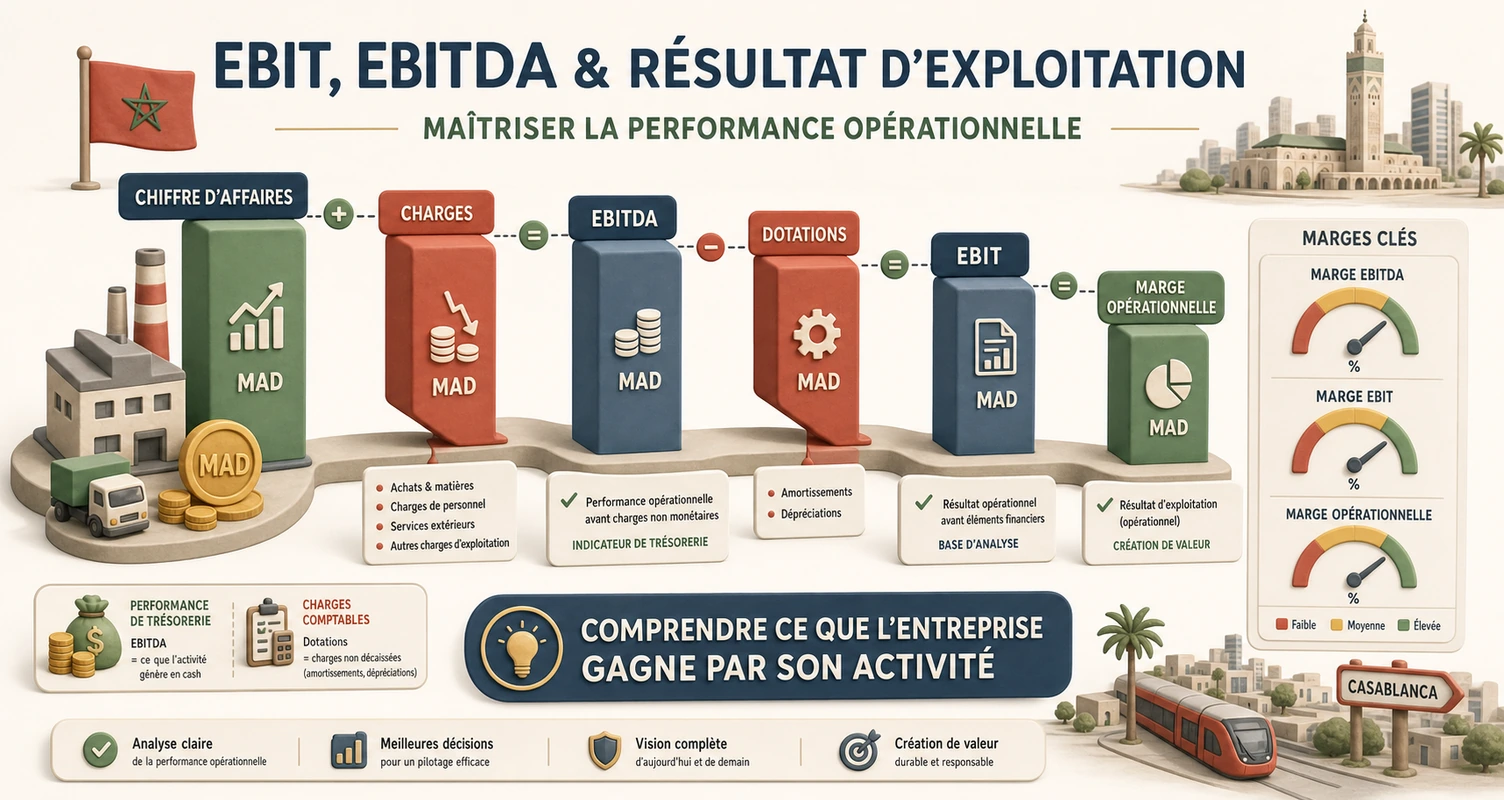
Cas pratique BVC – pourquoi la cascade compte
Cas pratique BVC : l’EBITDA est la metrique preferee des operateurs telecom et des banques d’affaires – il mesure la performance operationnelle avant amortissements et financement. Mais l’actionnaire ne peut pas ” depenser ” l’EBITDA : il faut soustraire le capex (fibre, 4G/5G), les impots, les interets et la variation du besoin en fonds de roulement pour arriver au free cash-flow. Ouvrez la fiche IAM et le comparateur Casabourse pour suivre cette cascade sur les exercices 2023-2025.
Definitions – de l’exploitation au cash
EBITDA = resultat d’exploitation + dotations aux amortissements (simplifie). Mesure la rentabilite du coeur de metier.
EBIT (resultat d’exploitation) = EBITDA − amortissements. IAM publie un operating income de 13,55 Mds MAD en 2025 ; en 2024 la ligne est non renseignee separement dans Casabourse mais l’ecart EBITDA/EBIT reflete l’usure des actifs reseau.
Resultat net = EBIT − charges financieres − impots ± exceptionnels. IAM 2024 : 1,80 Md (exceptionnellement bas) vs 6,97 Mds en 2025.
Free cash-flow (FCF) ≈ EBITDA − capex − impots cash − variation BFR. C’est ce qui finance dividende et desendettement.
Tableau cascade – Maroc Telecom 2024 (RFA)
| Etape cascade | IAM 2024 | IAM 2023 | Commentaire |
|---|---|---|---|
| Chiffre d’affaires | 36,70 Mds MAD | 36,79 Mds | Stable – parc mature |
| EBITDA | 19,20 Mds MAD | 19,37 Mds | Marge EBITDA ~52 % du CA |
| Amortissements (estime) | ~5,7 Mds MAD | ~5,5 Mds | Reseau fibre, licences, equipements |
| EBIT (operating income) | ~13,5 Mds MAD (estime) | ~13,9 Mds | EBITDA − amortissements |
| Capex (intensite ~16,5 % CA) | ~6,0 Mds MAD | ~5,8 Mds | Fibre, mobile, datacenters |
| EBITDA − Capex | ~13,2 Mds MAD | ~13,6 Mds | Cash operationnel brut avant impots/BFR |
| Resultat net | 1,80 Mds MAD | 5,28 Mds | 2024 : charges exceptionnelles |
| Dette nette | 22,4 Mds MAD | 16,4 Mds | Saut 2024 – EV mecaniquement plus haute |
| Dette nette / EBITDA | ~1,17x | ~0,85x | Levier structurel mais maitrise |
| Dividende (DPS) | 1,43 MAD | 4,20 MAD | Payout ~70 % sur RN normalise |
Sources : RFA 2024-2025 IAM, Casabourse. Capex estime ~16,5 % du CA (methode dashboard telecom Casabourse). Amortissements = EBITDA − EBIT publie 2025 extrapole.
Lecture – l’EBITDA n’est pas du cash disponible
IAM genere 19,2 Mds d’EBITDA – impressionnant. Mais ~6 Mds partent en capex pour maintenir et etendre le reseau. Il reste ~13,2 Mds avant impots, interets et BFR. Les charges financieres sur 22,4 Mds de dette nette absorbent une partie supplementaire. Moralite : un operateur telecom peut afficher un excellent EBITDA tout en distribuant un dividende qui depend du free cash-flow, pas de l’EBITDA brut.
Pourquoi le RN 2024 (1,80 Md) est sous l’EBITDA
L’ecart entre EBIT (~13,5 Mds) et RN (1,80 Md) s’explique par :
- Charges financieres sur la dette (~19,6 Mds dette brute 2025 en reference).
- Impots sur le resultat taxable.
- Elements exceptionnels en 2024 – restructurations, provisions, effets de change sur filiales africaines.
C’est pourquoi le PER 2024 (~44x) trompe : l’EBITDA reste autour de 19 Mds quand le RN s’effondre temporairement. Les analystes telecom valorisent souvent en EV/EBITDA (~5,4x pour IAM) plutot qu’en PER sur un an exceptionnel.
Trajectoire 2022-2025 – stabilite EBITDA, volatilite RN
| Exercice | EBITDA | RN | Dette nette | EBITDA − Capex (est.) |
|---|---|---|---|---|
| 2022 | 19,67 Mds | 2,75 Mds | 16,4 Mds | ~13,8 Mds |
| 2023 | 19,37 Mds | 5,28 Mds | 16,4 Mds | ~13,6 Mds |
| 2024 | 19,20 Mds | 1,80 Mds | 22,4 Mds | ~13,2 Mds |
| 2025 | 18,49 Mds | 6,97 Mds | 17,6 Mds | ~12,4 Mds |
L’EBITDA est remarquablement stable (~19 Mds ±3 %) ; le RN oscille fortement. Pour investir dans IAM, suivez l’EBITDA, le capex/CA et la dette nette autant que le PER.
Comparer dans le comparateur – IAM vs Marsa Maroc
Marsa Maroc affiche un EBITDA 2024 de 2,72 Mds pour un CA de 5,01 Mds (marge ~54 %) – comparable a IAM en intensite. Mais le capex portuaire est plus modere en proportion ; la conversion EBITDA → FCF est plus directe. Dans le comparateur, confrontez marge EBITDA, capex/CA et dette/EBITDA : deux secteurs capitalistiques, deux cascades de cash differentes.
Erreurs frequentes
- Confondre EBITDA et cash-flow operationnel sur des societes tres capex-intensives.
- Comparer EBIT entre secteurs sans normaliser les charges non recurrentes.
- Ignorer le resultat financier net sur les groupes endettes.
Choisissez la bonne réponse pour chaque question et consultez votre résultat à la fin.
La réponse attendue privilégie une décision structurée : faits, méthode, risque et cohérence avec le portefeuille.
La réponse attendue privilégie une décision structurée : faits, méthode, risque et cohérence avec le portefeuille.
La réponse attendue privilégie une décision structurée : faits, méthode, risque et cohérence avec le portefeuille.
La réponse attendue privilégie une décision structurée : faits, méthode, risque et cohérence avec le portefeuille.
La réponse attendue privilégie une décision structurée : faits, méthode, risque et cohérence avec le portefeuille.
حالة عملية BVC — لماذا التسلسل مهم
حالة عملية BVC: EBITDA المقياس المفضّل لمشغّلي الاتصالات وبنوك الاستثمار — يقيس الأداء التشغيلي قبل الاستهلاكات والتمويل. لكن المساهم لا يمكنه «إنفاق» EBITDA: يجب طرح capex (ألياف، 4G/5G)، الضرائب، الفوائد وتغير رأس المال العامل للوصول إلى التدفق النقدي الحر (FCF). افتح بطاقة IAM والمُقارِن Casabourse لمتابعة هذا التسلسل على السنوات 2023-2025.
التعريفات — من الاستغلال إلى النقد
EBITDA = نتيجة الاستغلال + مخصصات الاستهلاك (مبسّط). يقيس ربحية جوهر النشاط.
EBIT (نتيجة الاستغلال) = EBITDA − الاستهلاكات. IAM تنشر دخل تشغيل 13,55 مليار درهم في 2025؛ في 2024 السطر غير منفصل في Casabourse لكن الفجوة EBITDA/EBIT تعكس تآكل أصول الشبكة.
النتيجة الصافية = EBIT − الرسوم المالية − الضرائب ± الاستثناءات. IAM 2024: 1,80 مليار (منخفض استثنائياً) مقابل 6,97 مليار في 2025.
التدفق النقدي الحر (FCF) ≈ EBITDA − capex − ضرائب نقدية − تغير BFR. هذا ما يموّل التوزيع وتخفيض الدين.
جدول التسلسل — اتصالات المغرب 2024 (RFA)
| مرحلة التسلسل | IAM 2024 | IAM 2023 | تعليق |
|---|---|---|---|
| رقم الأعمال | 36,70 مليار درهم | 36,79 مليار | مستقر — سوق ناضج |
| EBITDA | 19,20 مليار درهم | 19,37 مليار | هامش EBITDA ~52% من رقم الأعمال |
| الاستهلاكات (مقدّر) | ~5,7 مليار درهم | ~5,5 مليار | شبكة ألياف، تراخيص، معدات |
| EBIT (دخل تشغيل) | ~13,5 مليار درهم (مقدّر) | ~13,9 مليار | EBITDA − الاستهلاكات |
| Capex (كثافة ~16,5% رقم الأعمال) | ~6,0 مليار درهم | ~5,8 مليار | ألياف، جوال، مراكز بيانات |
| EBITDA − Capex | ~13,2 مليار درهم | ~13,6 مليار | نقد تشغيلي إجمالي قبل ضرائب/BFR |
| النتيجة الصافية | 1,80 مليار درهم | 5,28 مليار | 2024: رسوم استثنائية |
| الدين الصافي | 22,4 مليار درهم | 16,4 مليار | قفزة 2024 — EV أعلى ميكانيكياً |
| الدين الصافي / EBITDA | ~1,17× | ~0,85× | رافعة هيكلية لكن مضبوطة |
| توزيع الأرباح (DPS) | 1,43 درهم | 4,20 درهم | Payout ~70% على RN مطبّع |
المصادر: RFA 2024-2025 IAM، Casabourse. Capex مقدّر ~16,5% من رقم الأعمال (منهج لوحة اتصالات Casabourse). الاستهلاكات = EBITDA − EBIT المنشور 2025 مُستقرى.
القراءة — EBITDA ليس نقداً متاحاً
IAM تولّد 19,2 مليار EBITDA — مثير للإعجاب. لكن ~6 مليار تذهب في capex لصيانة وتوسيع الشبكة. يبقى ~13,2 مليار قبل الضرائب والفوائد وBFR. الرسوم المالية على 22,4 مليار دين صافي تمتص جزءاً إضافياً. الخلاصة: مشغّل اتصالات قد يعرض EBITDA ممتازاً مع توزيع يعتمد على التدفق النقدي الحر، لا EBITDA الإجمالي.
لماذا RN 2024 (1,80 مليار) دون EBITDA
الفجوة بين EBIT (~13,5 مليار) وRN (1,80 مليار) تُفسَّر بـ:
- الرسوم المالية على الدين (~19,6 مليار دين إجمالي مرجع 2025).
- الضرائب على النتيجة الخاضعة للضريبة.
- بنود استثنائية في 2024 — إعادة هيكلة، مخصصات، آثار صرف على شركات تابعة أفريقية.
لذلك PER 2024 (~44×) مضلّل: EBITDA يبقى حول 19 مليار بينما ينهار RN مؤقتاً. محللو الاتصالات يُقيّمون غالباً بـ EV/EBITDA (~5,4× لـ IAM) بدلاً من PER على سنة استثنائية.
مسار 2022-2025 — استقرار EBITDA، تقلب RN
| السنة المالية | EBITDA | RN | الدين الصافي | EBITDA − Capex (تقدير) |
|---|---|---|---|---|
| 2022 | 19,67 مليار | 2,75 مليار | 16,4 مليار | ~13,8 مليار |
| 2023 | 19,37 مليار | 5,28 مليار | 16,4 مليار | ~13,6 مليار |
| 2024 | 19,20 مليار | 1,80 مليار | 22,4 مليار | ~13,2 مليار |
| 2025 | 18,49 مليار | 6,97 مليار | 17,6 مليار | ~12,4 مليار |
EBITDA مستقر بشكل ملحوظ (~19 مليار ±3%)؛ RN يتأرجح بقوة. للاستثمار في IAM، تابع EBITDA وcapex/رقم الأعمال والدين الصافي بقدر PER.
المقارنة في المُقارِن — IAM مقابل مرسى المغرب
مرسى المغرب تعرض EBITDA 2024 2,72 مليار لرقم أعمال 5,01 مليار (هامش ~54%) — قابل للمقارنة مع IAM في الكثافة. لكن capex الموانئ أخف نسبياً؛ تحويل EBITDA → FCF أكثر مباشرة. في المُقارِن، واجه هامش EBITDA وcapex/رقم الأعمال والدين/EBITDA: قطاعان رأسماليان، تسلسلان نقديان مختلفان.
اختر الإجابة الصحيحة لكل سؤال واطلع على نتيجتك في النهاية.
EBITDA 2024 المنشور 19,197 مليار درهم؛ رقم الأعمال 36,7 مليار.
16,5% × 36,7 مليار ≈ 6 مليار capex شبكة.
EBITDA قبل الاستهلاكات والفوائد والبنود الاستثنائية.
22,4 مليار / 19,2 مليار ≈ 1,17 مرة.
EV/EBITDA يدمج الدين ويُنعّم سنوات RN الاستثنائية.
BVC practical case — why the cascade matters
BVC practical case: EBITDA is the preferred metric for telecom operators and investment banks — it measures operating performance before depreciation and financing. But shareholders cannot “spend” EBITDA: you must subtract capex (fibre, 4G/5G), taxes, interest and the change in working capital to reach free cash flow. Open the IAM company page and the Casabourse comparator to track this cascade across 2023–2025.
Definitions — from operations to cash
EBITDA = operating profit + depreciation charges (simplified). It measures core business profitability.
EBIT (operating income) = EBITDA − depreciation. IAM reported operating income of 13.55 bn MAD in 2025; in 2024 the line is not shown separately on Casabourse, but the EBITDA/EBIT gap reflects wear on network assets.
Net income = EBIT − financial charges − taxes ± exceptional items. IAM 2024: 1.80 bn (exceptionally low) vs 6.97 bn in 2025.
Free cash flow (FCF) ≈ EBITDA − capex − cash taxes − change in working capital. This is what funds dividends and deleveraging.
Cascade table — Maroc Telecom 2024 (RFA)
| Cascade step | IAM 2024 | IAM 2023 | Comment |
|---|---|---|---|
| Revenue | 36.70 bn MAD | 36.79 bn | Stable — mature subscriber base |
| EBITDA | 19.20 bn MAD | 19.37 bn | EBITDA margin ~52% of revenue |
| Depreciation (estimated) | ~5.7 bn MAD | ~5.5 bn | Fibre network, licences, equipment |
| EBIT (operating income) | ~13.5 bn MAD (estimated) | ~13.9 bn | EBITDA − depreciation |
| Capex (intensity ~16.5% of revenue) | ~6.0 bn MAD | ~5.8 bn | Fibre, mobile, data centres |
| EBITDA − Capex | ~13.2 bn MAD | ~13.6 bn | Gross operating cash before taxes/working capital |
| Net income | 1.80 bn MAD | 5.28 bn | 2024: exceptional charges |
| Net debt | 22.4 bn MAD | 16.4 bn | 2024 jump — EV mechanically higher |
| Net debt / EBITDA | ~1.17x | ~0.85x | Structural leverage but under control |
| Dividend (DPS) | 1.43 MAD | 4.20 MAD | Payout ~70% on normalised net income |
Sources: IAM RFA 2024–2025, Casabourse. Capex estimated at ~16.5% of revenue (Casabourse telecom dashboard method). Depreciation = EBITDA − published 2025 EBIT, extrapolated.
Reading — EBITDA is not available cash
IAM generates 19.2 bn in EBITDA — impressive. But ~6 bn goes to capex to maintain and expand the network. That leaves ~13.2 bn before taxes, interest and working capital. Financial charges on 22.4 bn of net debt absorb an additional slice. The lesson: a telecom operator can show excellent EBITDA while paying a dividend that depends on free cash flow, not gross EBITDA.
Why 2024 net income (1.80 bn) is far below EBITDA
The gap between EBIT (~13.5 bn) and net income (1.80 bn) is explained by:
- Financial charges on debt (~19.6 bn gross debt in 2025 for reference).
- Taxes on taxable profit.
- Exceptional items in 2024 — restructurings, provisions, exchange-rate effects on African subsidiaries.
That is why the 2024 P/E (~44x) is misleading: EBITDA stays around 19 bn when net income collapses temporarily. Telecom analysts often value on EV/EBITDA (~5.4x for IAM) rather than P/E in an exceptional year.
2022–2025 trajectory — stable EBITDA, volatile net income
| Year | EBITDA | Net income | Net debt | EBITDA − Capex (est.) |
|---|---|---|---|---|
| 2022 | 19.67 bn | 2.75 bn | 16.4 bn | ~13.8 bn |
| 2023 | 19.37 bn | 5.28 bn | 16.4 bn | ~13.6 bn |
| 2024 | 19.20 bn | 1.80 bn | 22.4 bn | ~13.2 bn |
| 2025 | 18.49 bn | 6.97 bn | 17.6 bn | ~12.4 bn |
EBITDA is remarkably stable (~19 bn ±3%); net income swings sharply. To invest in IAM, track EBITDA, capex/revenue and net debt as much as P/E.
Compare in the comparator — IAM vs Marsa Maroc
Marsa Maroc shows 2024 EBITDA of 2.72 bn on revenue of 5.01 bn (margin ~54%) — comparable to IAM in intensity. But port capex is more moderate in proportion; EBITDA → FCF conversion is more direct. In the comparator, compare EBITDA margin, capex/revenue and debt/EBITDA: two capital-intensive sectors, two different cash cascades.
Key takeaways
- IAM 2024 EBITDA: 19.2 bn MAD — stable operating performance.
- Capex ~6 bn (~16.5% of revenue) — do not confuse EBITDA with free cash.
- Net debt 22.4 bn — debt/EBITDA ~1.17x.
- Exceptional 2024 net income (1.80 bn) — misleading P/E; prefer EV/EBITDA.
- Cascade: EBITDA − capex − taxes/working capital ≈ FCF available for dividends.
Self-check
- What was IAM’s EBITDA in 2024?
- What is the order of magnitude of IAM capex (intensity ~16.5% of revenue)?
- Why was 2024 net income far below EBITDA?
- What was IAM’s net debt/EBITDA ratio in 2024?
- Which metric complements P/E when valuing a telecom?
Ce contenu est fourni a des fins educatives. Il ne constitue pas un conseil en investissement personnalise ni une recommandation d acheter ou vendre une valeur. Verifiez toujours vos hypotheses, votre horizon et votre tolerance au risque.